Report Designer (v2021.1+)
The Report Designer is the main editor for Advanced and CrossTab Reports. A full suite of reporting and design tools with a spreadsheet-like interface is available.
The Advanced Report Designer
Reports may be sorted, grouped and filtered on data from several sources. The flexibility of the Designer allows for simple reports as well as very complex reports with many calculations, graphics, charts, maps and interactivity to be created. Advanced Reports can link to other reports for drilling further down into background data. Files (also known as templates) may be uploaded to the Designer to dynamically fill form fields or automatically include data in documents.
The Advanced Designer is comprised of several different parts: the Data Objects Pane, the Toolbar, the Formula Bar and the Design Grid.
Data Objects Pane
The Data Objects Pane on the left side of the Designer contains the available data objects that may be added to the report’s design grid. Data objects are arranged into folders. Those objects are further expanded into fields. A field is a parcel of data from a data object, such as the name of a Product or an Employee ID number.
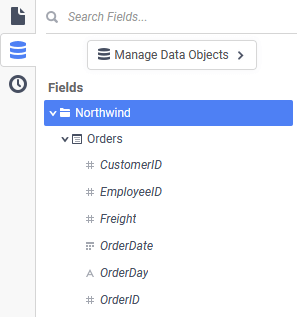
Data Objects Tree
Use the Search Fields area to search for fields by name.
Browse through the folders of objects and expand the objects to see the fields available. Some fields may have a description associated with them. Hold the mouse over the field name to see the description.
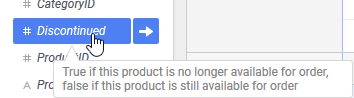
A field with a description that appears as a tooltip
More information can be found in the Advanced Reports: Data Objects article.
Toolbar
The toolbar contains the buttons and menus used to modify the report. Modifications can include aesthetic formatting, inserting formulas and images, linking reports, and much more.
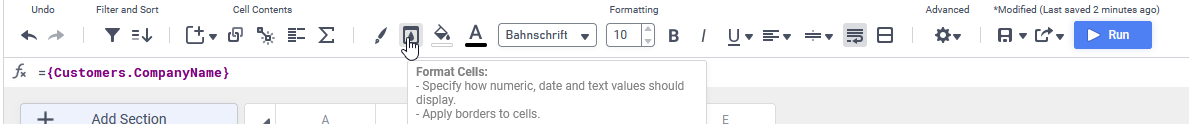
The v2021.1+ Report Designer toolbar, with mouse pointer hovering the Format Cells icon
The system administrator has the ability to hide or show specific menu options and toolbar items. Some items may not be available.
 Undo — most actions on a report can be undone by clicking this icon or pressing Ctrl + Z on the keyboard.
Note
Changing filters, sorts, joins, data objects and other items from the menus are not undo-able.
- Redo — undone actions can be redone by clicking this icon or pressing Ctrl + Y on the keyboard.
- Filter — open the Report Filters dialog to create, modify or remove Filters, which limit the data on the report based on criteria. Full details on filtering can be found in the Filters article.
- Sorts — open the Report Sorts dialog to create, modify or remove Sorts, which order data on the report. Sorts are also required for utilizing Groups, a type of section. Full details on sorting and grouping can be found in the respective Sorts and Sections articles.
- Insert — insert an item into the selected cell. Choose from:
- Chart — add a graphical visualization (e.g. a bar chart, line graph, pie chart). See the Charts article.
- Gauge — add a gauge visualization (e.g. a thermometer or angular dial gauge). See the Gauges article.
- GeoChart — add a basic geographical map visualization. See the GeoCharts article.
- Google Maps — add a fully interactive geographical map visualization. See the Google Maps article.
- CrossTab — add a dynamically expanding pivot table. See the CrossTab Reports article.
- Image — add an image file to the cell
- Formula — add a formula to the cell using the Formula Editor. See the Formulas section.
- Linked Report — link this cell dynamically to another report, to drill into background data. See the Linked Reports (Drilldowns) article.
- Linked Action Event — link an Action Event to this cell. Action Events are custom bits of functionality created by the system administrator that respond to certain actions such as clicking on icons or parts of a chart. This is an advanced feature, contact the system administrator for assistance.
- Suppress Duplicates (pre-v2021.1.1) / Hide Repeated Values (v2021.1.1+) — enable this feature to hide duplicated values from appearing after one another in a report. See the Dealing with Duplicate Values article.
- AutoSum — to quickly get a total on a data field, place the field in a Report or Group Footer section then click this icon. Do not use AutoSum on a cell with an aggregate formula such as aggSum.
Caution
Aggregating some Data Sources and data types, such as floating point columns in Google BigQuery sources, may cause non-deterministic results due to limitations in the Data Source.
- Advanced — access additional option dialogs to control advanced features of the report
- Report Viewer Options — open the Report Viewer Options dialog to control display options, interactive filters and sorts
- General Options — open the Report Options dialog to control execution, exporting, filter window and page display options
- Custom Options — open the Custom Options dialog for setting the value of extensibility options. This is an advanced feature, contact your system administrator for assistance with it.
- Joins — open the Joins dialog to define how the data objects on the report relate to one another. See Joins for more information.
- Show SQL — view the generated SQL query which retrieves the data used on the report. See Show Generated SQL.
- Templates — setup document templates and forms. See Templates.
- Execution Caching — allows the data from a report execution to be cached so that reports can be viewed more quickly and with less stress to the data source
- Events — link a Server Event to the report. Server Events are custom bits of functionality created by the system administrator that occur when certain application triggers occur such as when the report is loaded, saved or during the execution cycle. See the Events section of the Advanced Options article.
- Parameters — define reusable system variables, called Parameters, on the report. See Report-Level Parameters.
- Save Report — save the report to the system. On the first click, or by clicking the dropdown arrow icon, provide a name, optional description, optional filter description (if enabled) and folder to save the report to.
- Export Report — save the report as a downloadable PDF, Excel, RTF or CSV file.
- Run — execute the report in the application’s Report Viewer.
- / Execution Caching — the data displayed on this report comes from a cache that is periodically updated. Click the Cache Invalid icon to manually update the cache. When the Cache Valid icon is displayed, the cache is valid. A report may only be run when the cache is valid.
- Format Paintbrush — select a cell to copy the formatting from, click this icon and then click another cell to copy the formatting to
- Format Cells — open the Format Cells dialog to change data formatting, borders and conditional formatting settings. See Cell Formatting.
- Background Color — select a cell, then click this icon to change the cell’s background color with the color chooser.
- Foreground Color — select a cell, then click this icon to change the cell’s foreground/text color with the color chooser.
- Font and Font Size — select a cell, then click the dropdown to choose a different font. Use the up and down arrows to change the size of the font, or enter a number directly.
- Bold — select a cell, then click this icon to change the font weight to Bold. Click again to remove bold weight.
- Italic — select a cell, then click this icon to change the font style to Italic. Click again to remove italic styling.
- Underline — select a cell, then click this icon to change the font style to change the font style to Underlined. Click again to remove underline styling. Click the dropdown arrow icon to choose the underline type, either Single or Double.
- Horizontal Alignment — select a cell, then click this icon to change the horizontal alignment of the content of the cell. Choose from:
- Left
- Center
- Right
- Justified
- Vertical Alignment — select a cell, then click this icon to change the vertical alignment of the content of the cell. Choose from:
- Top
- Middle
- Bottom
 Undo — most actions on a report can be undone by clicking this icon or pressing Ctrl + Z on the keyboard.
 Redo — undone actions can be redone by clicking this icon or pressing Ctrl + Y on the keyboard.
 Filter — open the Report Filters dialog to create, modify or remove Filters, which limit the data on the report based on criteria. Full details on filtering can be found in the

 Insert — insert an item into the selected cell. Choose from:
 Chart — add a graphical visualization (e.g. a bar chart, line graph, pie chart). See the
  Gauge — add a gauge visualization (e.g. a thermometer or angular dial gauge). See the
  GeoChart — add a basic geographical map visualization. See the
  Google Maps — add a fully interactive geographical map visualization. See the
  CrossTab — add a dynamically expanding pivot table. See the
  Image — add an image file to the cell
 Formula — add a formula to the cell using the Formula Editor. See the
  Linked Report — link this cell dynamically to another report, to drill into background data. See the
  Linked Action Event — link an Action Event to this cell. Action Events are custom bits of functionality created by the system administrator that respond to certain actions such as clicking on icons or parts of a chart. This is an advanced feature, contact the system administrator for assistance.
 Suppress Duplicates (pre-v2021.1.1) / Hide Repeated Values (v2021.1.1+) — enable this feature to hide duplicated values from appearing after one another in a report. See the
  AutoSum — to quickly get a total on a data field, place the field in a Report or Group Footer section then click this icon. Do not use AutoSum on a cell with an aggregate formula such as aggSum.
 Advanced — access additional option dialogs to control advanced features of the report
 Report Viewer Options — open the
  General Options — open the
  Custom Options — open the Custom Options dialog for setting the value of extensibility options. This is an advanced feature, contact your system administrator for assistance with it.
 Joins — open the Joins dialog to define how the data objects on the report relate to one another. See
  Show SQL — view the generated SQL query which retrieves the data used on the report. See
  Templates — setup document templates and forms. See
  Execution Caching — allows the data from a report execution to be cached so that reports can be viewed more quickly and with less stress to the data source
 Events — link a Server Event to the report. Server Events are custom bits of functionality created by the system administrator that occur when certain application triggers occur such as when the report is loaded, saved or during the execution cycle. See the
  Parameters — define reusable system variables, called Parameters, on the report. See

 Run — execute the report in the application’s
  /
/  Execution Caching — the data displayed on this report comes from a cache that is periodically updated. Click the Cache Invalid
  Format Paintbrush — select a cell to copy the formatting from, click this icon and then click another cell to copy the formatting to
 Format Cells — open the Format Cells dialog to change data formatting, borders and conditional formatting settings. See
  Background Color — select a cell, then click this icon to change the cell’s background color with the color chooser.
 Foreground Color — select a cell, then click this icon to change the cell’s foreground/text color with the color chooser.
 Font and Font Size — select a cell, then click the dropdown to choose a different font. Use the up and down arrows to change the size of the font, or enter a number directly.
 Bold — select a cell, then click this icon to change the font weight to Bold. Click again to remove bold weight.
 Italic — select a cell, then click this icon to change the font style to Italic. Click again to remove italic styling.
 Horizontal Alignment — select a cell, then click this icon to change the horizontal alignment of the content of the cell. Choose from:
 Left
Left Right
Right Justified
 Vertical Alignment — select a cell, then click this icon to change the vertical alignment of the content of the cell. Choose from:
 Top
Top Bottom
Formula Bar

A formula may be added to cells by directly entering them into this formula bar. Click the Formula Editor icon in the bar to open the Formula Editor for assistance building the formula. Just as when entering formulas directly into cell content, formulae should be prefixed with an equals sign.
Examples
={Orders.OrderDate}
=AggCount({Products.ProductName})
=[A5]
Additional Resources
For more information about formulas, review these articles:
Design Grid
The Report Designer works in a spreadsheet-like interface with content residing in cells arranged into rows and columns. Cells may contain plain text, data from data objects, formulas, images, charts, maps and gauges.
The Design Grid can be broken down into sections that dictate more finite control of how and where content appears on the finished report. Available section types include Page Header, Report Header, Group Header, Detail, Repeating Groups, Group Footer, Report Footer and Page Footer.
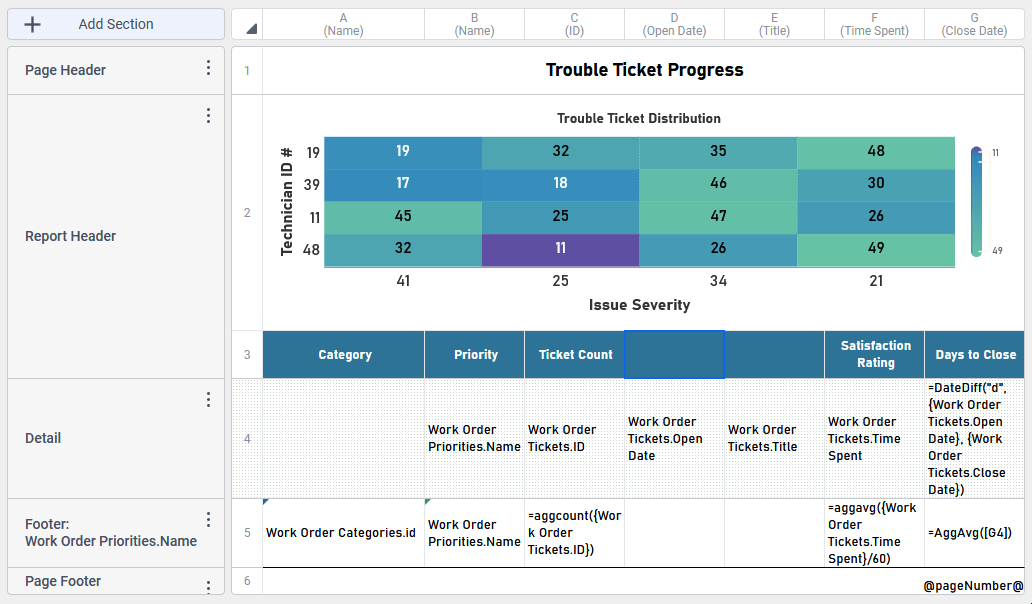
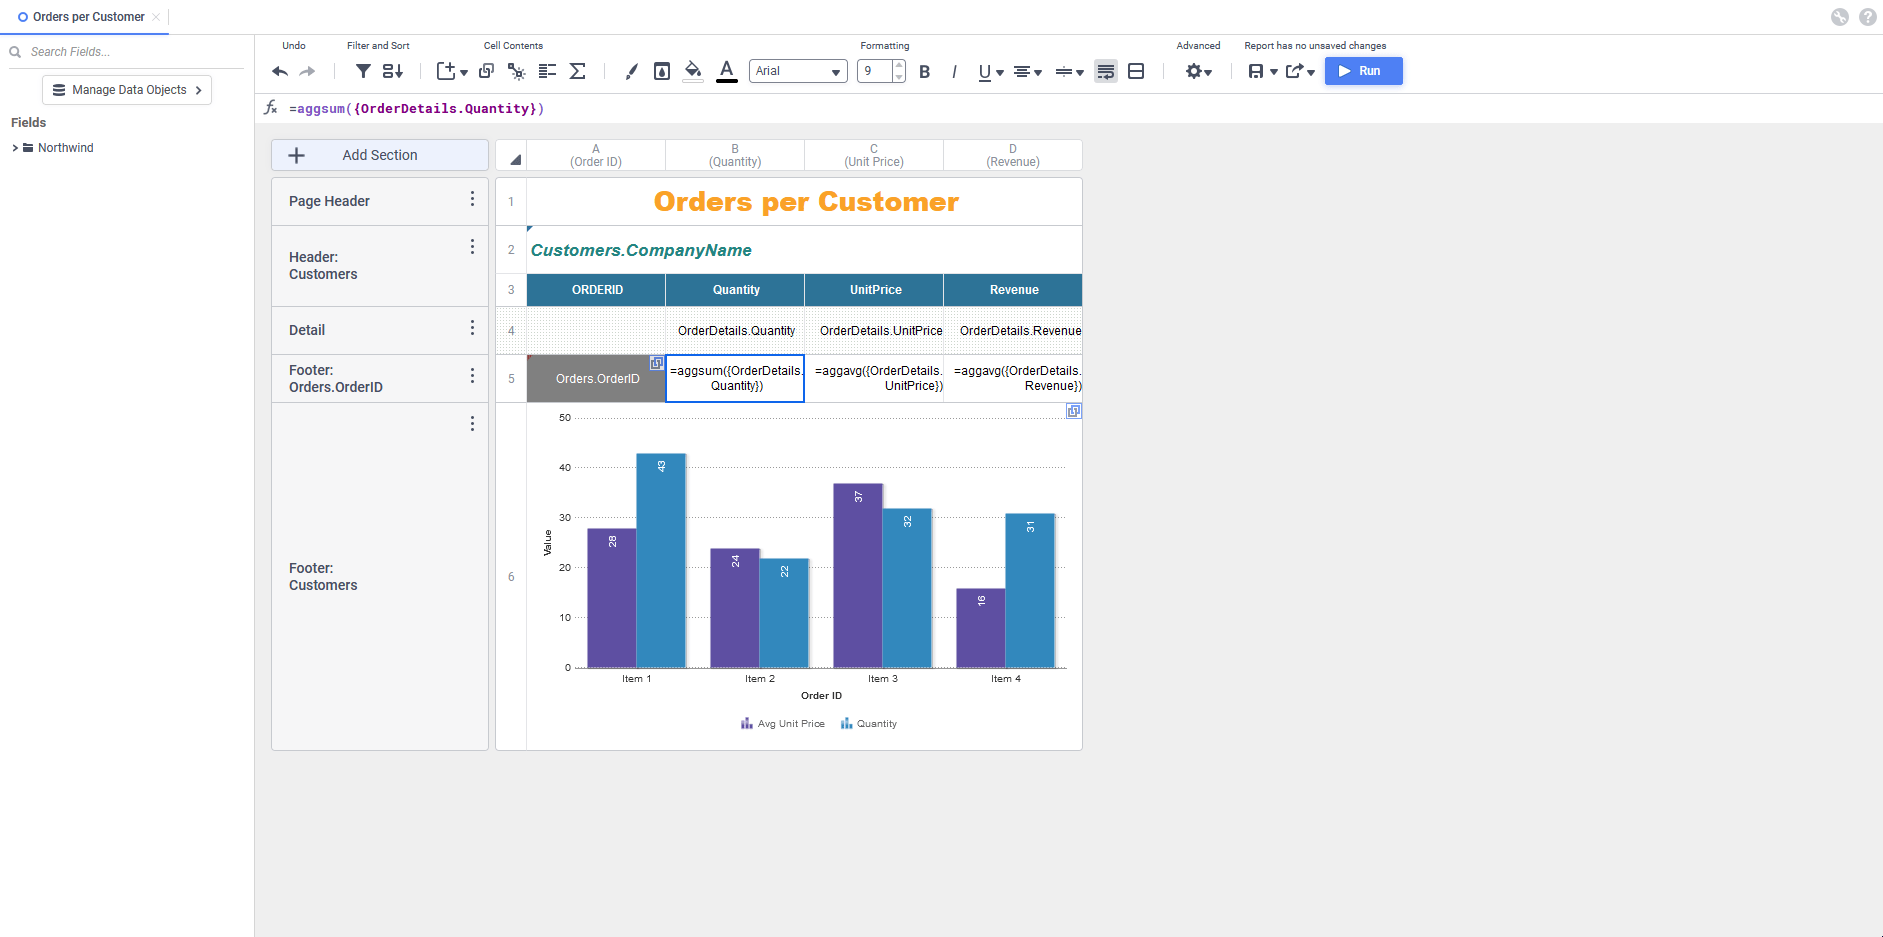
The Design Grid of an Advanced Report with five sections including a heatmap visualization, a suppressed detail section and a group footer
More information can be found in the Advanced Reports: Design Grid and Advanced Reports: Sections and Advanced Reports: Cell Formatting articles.
