ExpressView: Visualizations (v2021.1+)
Visualizations, also known as charts or graphs allow data to be showcased in a visual format. They allow data to be scanned quickly for patterns and trends. Charts can be easily made and customized in ExpressViews, in as little as one click.
Note
This section applies to ExpressView in v2021.1+ of the application. For previous versions, refer to ExpressView (pre-v2021.1)
Table of Contents
Use the links below to skip to the applicable section of this article.
Adding a Visualization
To add a chart to an ExpressView:
- Click the Add Visualization
 icon in the toolbar. A bar chart is added and populated with the data from the ExpressView automatically.
 - On the Visualizations tab of the Properties Pane, select the type of chart you want to use. The chart immediately swaps to that type. Choose from Bar and Column, Pie and Other Single-Series, Line and Area or Miscellaneous. Review the Type section below for more information about each type.
 icon in the toolbar. A bar chart is added and populated with the data from the ExpressView automatically.
There are three small icons in the lower-right corner of the visualization that determine where on the canvas the chart will appear. Choose from:
-
/ — the chart will appear on the top of the canvas; report data will be on the bottom
-
/ — the chart will appear on the bottom of the canvas; report data will be on the top
-
/ — the chart will fill the canvas; report data will be hidden
 /
/  — the chart will appear on the top of the canvas; report data will be on the bottom
 /
/  — the chart will appear on the bottom of the canvas; report data will be on the top
 /
/  — the chart will fill the canvas; report data will be hidden
Use the  Visualizations tab of the Properties Pane to customize the visualization:
Type
Choose one of the available chart types to display. Charts are organized into four general categories. Click each type name for additional information.
- Bar and Column
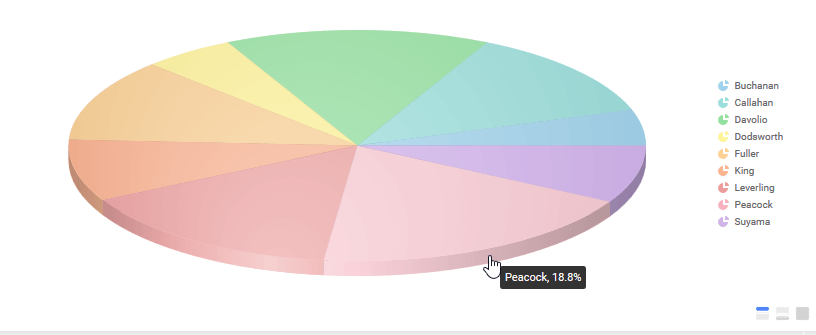
- Pie and Other Single-Series
- Line and Area
- Miscellaneous
Data
Labels
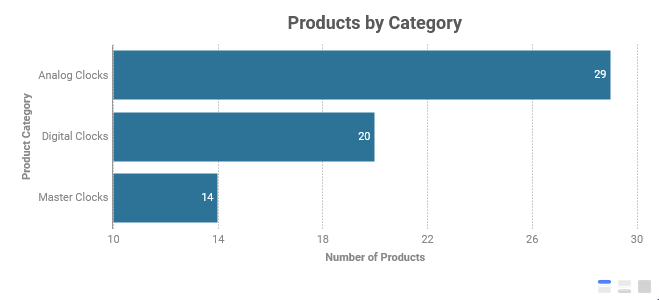
The Labels field is a group of data values, for each iteration of the group represented as a series on the chart. For example, using the Product Category group field as the label field represents each category as a series.
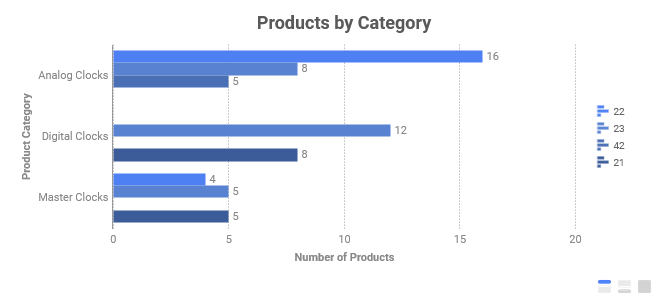
Several chart types allow more than one label field. This is useful for nested groups, which represent common series measured across several groups. For example, to compare the number of products in each category manufactured by a particular manufacturer, a nested manufacturer field can be added as a second label.
To add a chart label, either:
- Drag a data field from the Data Objects Pane onto the chart and release on the Add Label drop zone.
Adding LastNameas a label by dragging it to the drop zone on the chart - In the Visualizations tab, click the Data tab. Either:
- Drag a data field to the Labels drop zone.
- Click Add Label, then select a field from the Field list.
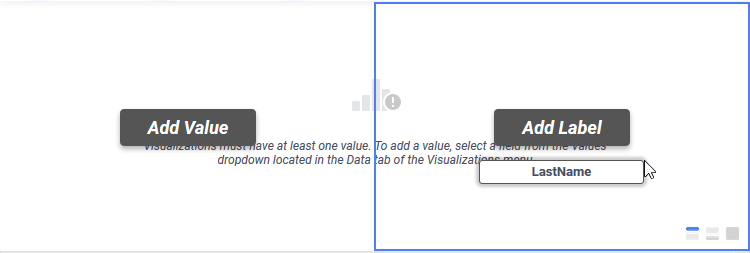
 Add Label, then select a field from the Field list.
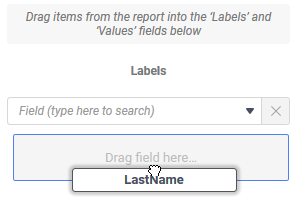
LastName as a label by dragging it to the drop zone in the Properties PaneValues
The Values fields are the data values to plot on the chart for each iteration of each labels group. For example, the products per category.
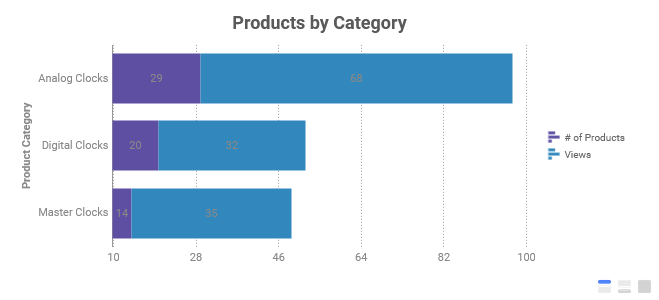
Several chart types allow for multiple values fields. This is useful if there are common series to be measured across several groupings, and the values fields are in the same data row. For example, the number of products per category and the number of views of those products on the online shopping site.
To add a chart value, either:
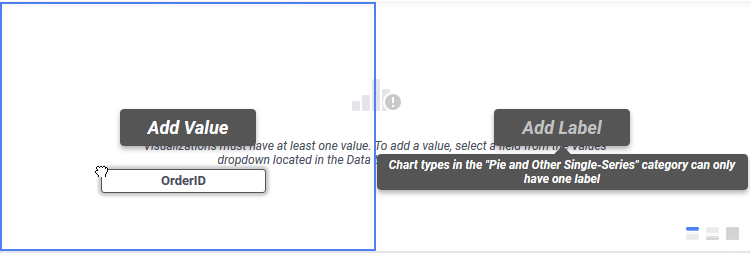
- Drag a data field onto the chart and release on the Add Value drop zone.
Adding OrderIdas a value by dragging it to the drop zone on the chart - In the Visualizations tab, click the Data tab. Either:
- Drag a data field to the Values area.
- Click Add Value, then select a field from the Field list.
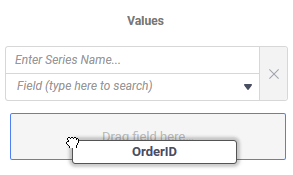
OrderId as a value by dragging it to the drop zone on the Properties PaneAppearance
Set the styling for the Chart Titles, Chart Colors and Chart Data:
Chart Titles
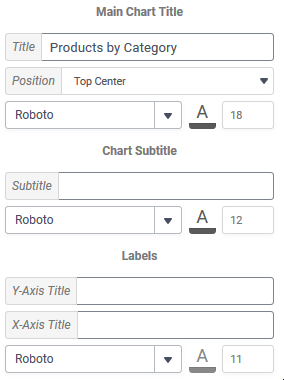
Add a main title and subtitle, as well as X-Axis and Y-Axis labels in this section. Each title may have a unique font, color and size.
Chart Colors
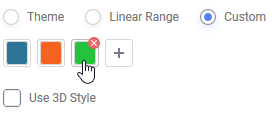
Select a palette to color the chart elements with. Choose from:
- Theme — a variety of named color themes are available (e.g. Blue Gray, Emerald Forest, Prismatic Wave, etc…)
- Linear Range — choose a starting and ending color. The application will interpolate intermediate colors for 3 or more chart elements as needed.
- Custom — the color of each element may be explicitly specified by manually choosing colors
Check the Use 3D Style checkbox to enable a three-dimensional effect on the chart elements.
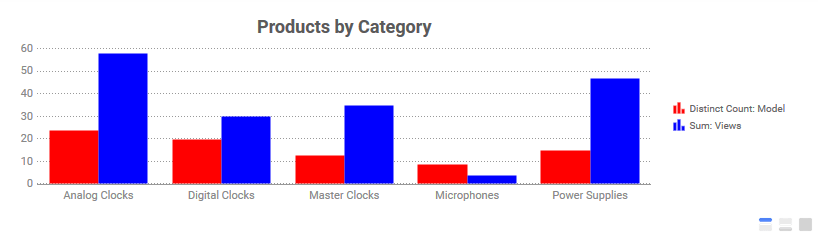
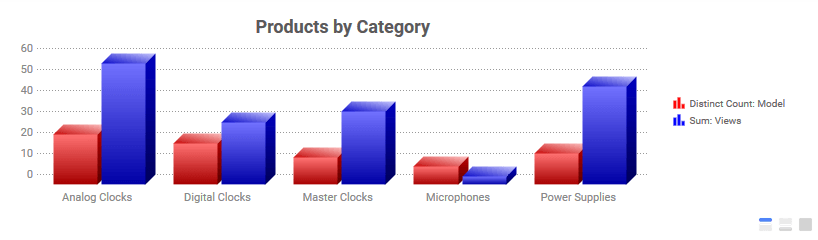
Chart Data
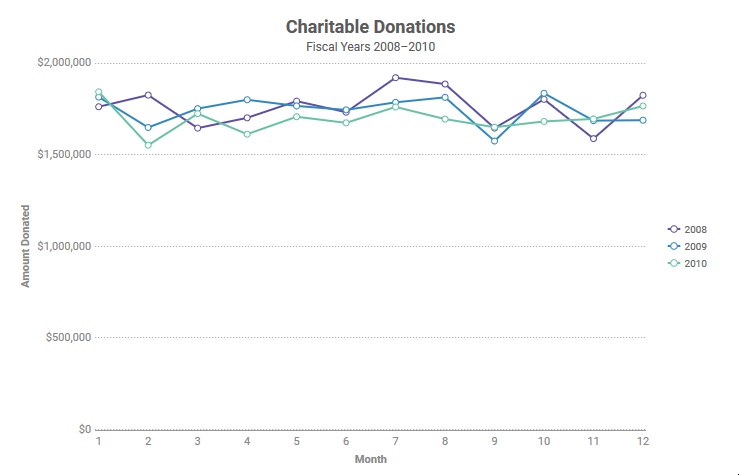
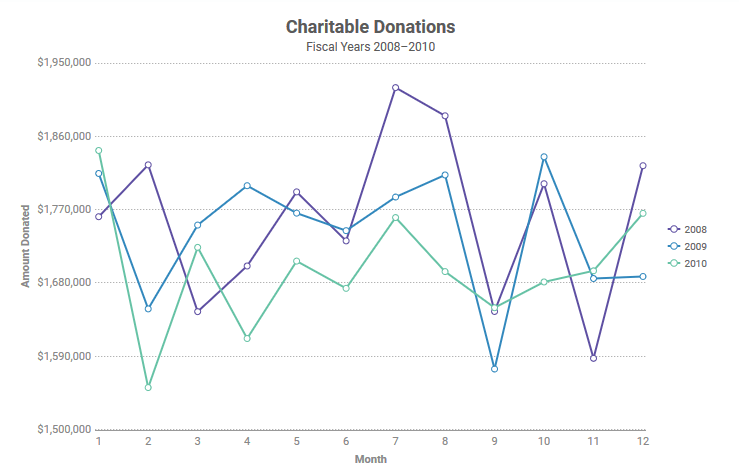
Use the Data Axis Min Value and Data Axis Max Value fields to set the minimum and maximum values for the axes. All values in the chart must be above the Data Axis Min Value and less than Data Axis Max Value otherwise this setting will be ignored. These settings can help make a chart easier to read. For example:
Use the Exclude Values Less Than and Exclude Values Greater Than settings to exclude values outside of the set range from appearing on the chart.
Use the Sort By dropdown to apply a secondary sort to the chart that will affect the order Values are added to the visualization. Choose from Ascending or Descending order by selecting from the dropdown. The options available will differ by chart type, but in general they are:
- Report Order — data points are added to the chart in the order they appear on the report
- Data Labels — data points are sorted by their Labels
- Data Values — data points are sorted by the Values
Point Labels will display the exact values of each point on the chart. Different chart types will have different options available, but in general they are:
- Series Values or Point Value — display the value of the values or point
- Percent of Series Values or Percent of Point Value — displays the percentage of the whole represented by this value or point
- Data Labels or Point Label — display the names of the Labels represented by each segment of the chart
- Data Labels with Data Values or Point Label with Point Values — combine the behavior of both Data Labels and Series Values modes to place both pieces of information in the label
For some charts, the Point Labels may be positioned with the Label Position setting. Choose from:
- Auto: allow the application to select the best orientation for you based on available space
-
Slant: rotate the labels 45-degrees along the axis
-
Wrap: texts wraps to a new line
-
Stagger: values are staggered along two lines so they don’t overlap
-
Rotate: rotate the labels 90-degrees along the axis
-
None: do not apply any change to labels, they may overlap
 Slant: rotate the labels 45-degrees along the axis
 Wrap: texts wraps to a new line
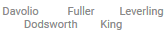 Stagger: values are staggered along two lines so they don’t overlap
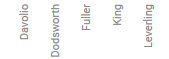 Rotate: rotate the labels 90-degrees along the axis
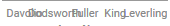 None: do not apply any change to labels, they may overlap
To include a Legend on the chart, click either Right or Bottom. Choose None to remove the legend.
The Number Format settings determine how numbers appear on the axes and in the Point Labels (if applicable):
- Decimal Places — will force a specified number of decimal places to be displayed. The symbol inserted between the whole and fractional part of the number can also be specified.
- Use 1000 Separator — when checked, will separate thousands places with the specified symbol
- Use Currency Symbol — when checked, will display the specified currency symbol in front of the value (e.g. $3.14)
- Append Percent Sign (%) — when checked, will display a percent sign (%) after the value (e.g. 3.14%)
Interactive Editing
Drilling Down
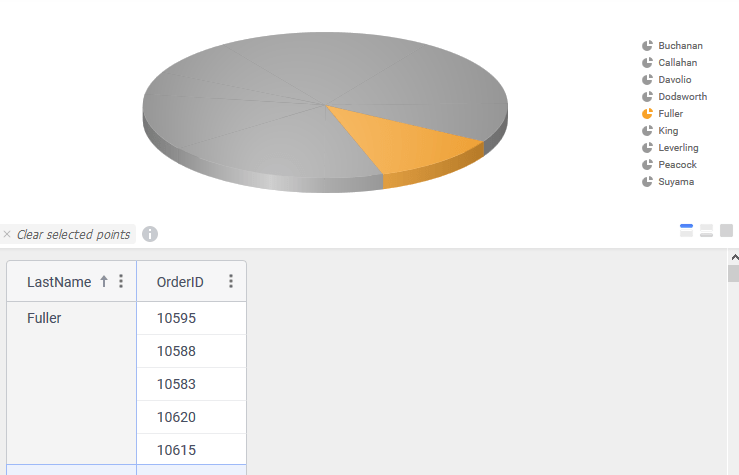
When Live Data (Run) is enabled, click on a chart series to drilldown the data to that series.
Note
Because some of the data is hidden in this mode, totals and other calculations may not be accurate.
Several series may be drilled at the same time.
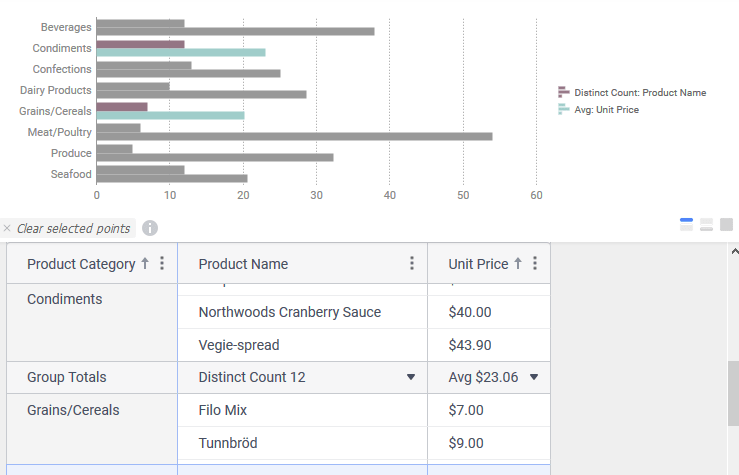
Click  Clear selected points to remove the drilldown and return to the original report design.
Editing a Chart Directly
Right-click on a chart to open the interactive menu.
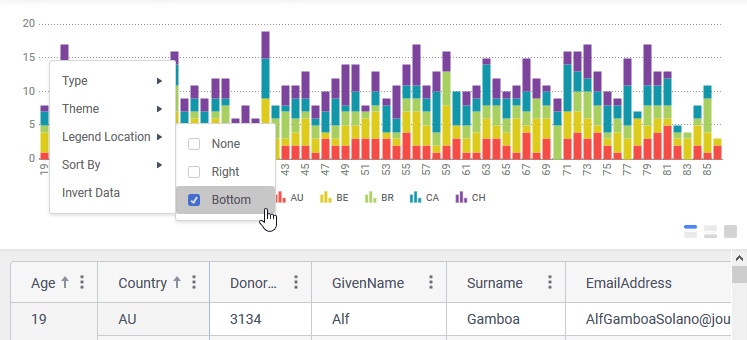
Choose from:
- Type — change the chart from one type to another as in the Type section of the Properties Pane. Only charts of the same series type may be selected. That is, if the chart is a multi-series type of chart only other mutli-series charts may be selected.
- Theme — change the color palette of the chart as in the Chart Colors section of the Properties Pane
- Legend Location — change the location of the legend
- Sort By — change the sort order on the chart as in the Chart Data section of the Properties Pane
- Invert Data — swap the data fields on the X and Y axes
Suggested Reading
Additional resources may prove helpful when working with ExpressView and ExpressView Visualizations:
