What’s New in Version 2021.1
ExpressView
The ExpressView design experience has been completely revamped. From a new report layout to new themes, export formats and summary building tools.
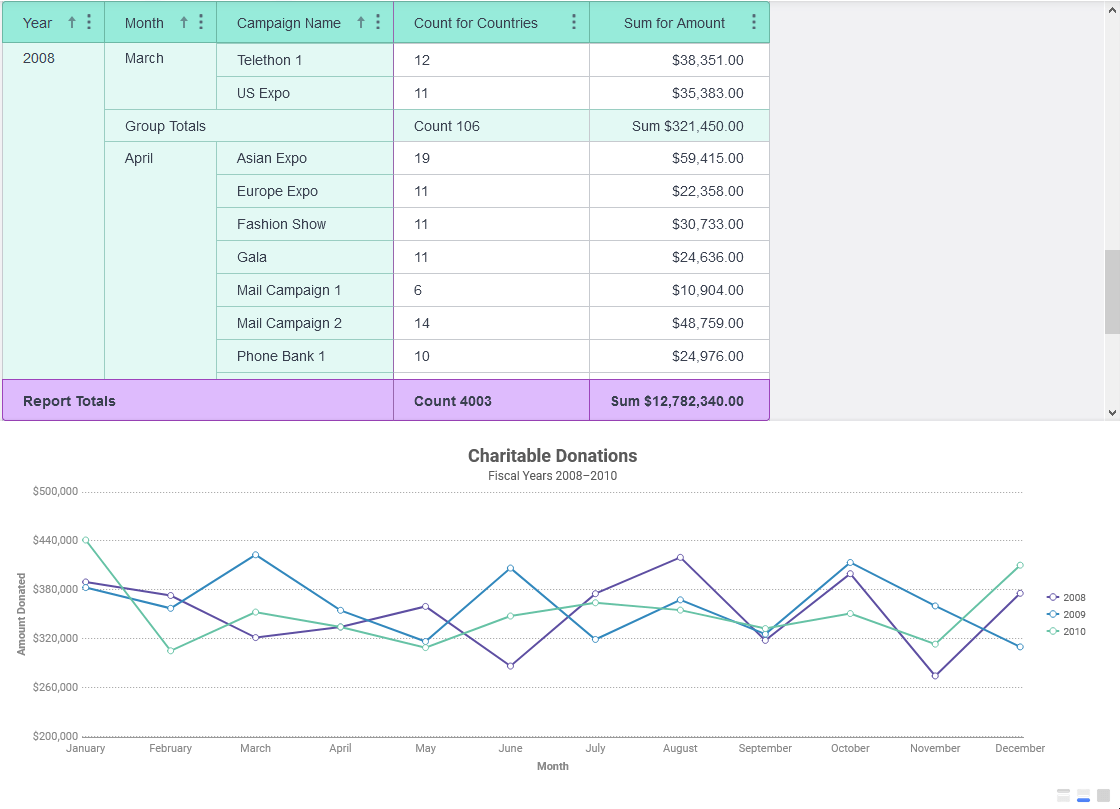
New Report Layout
The ExpressView canvas has been completely overhauled with a new design that is focused on cleaner data presentation and easier consumption for more varied types of report layouts.
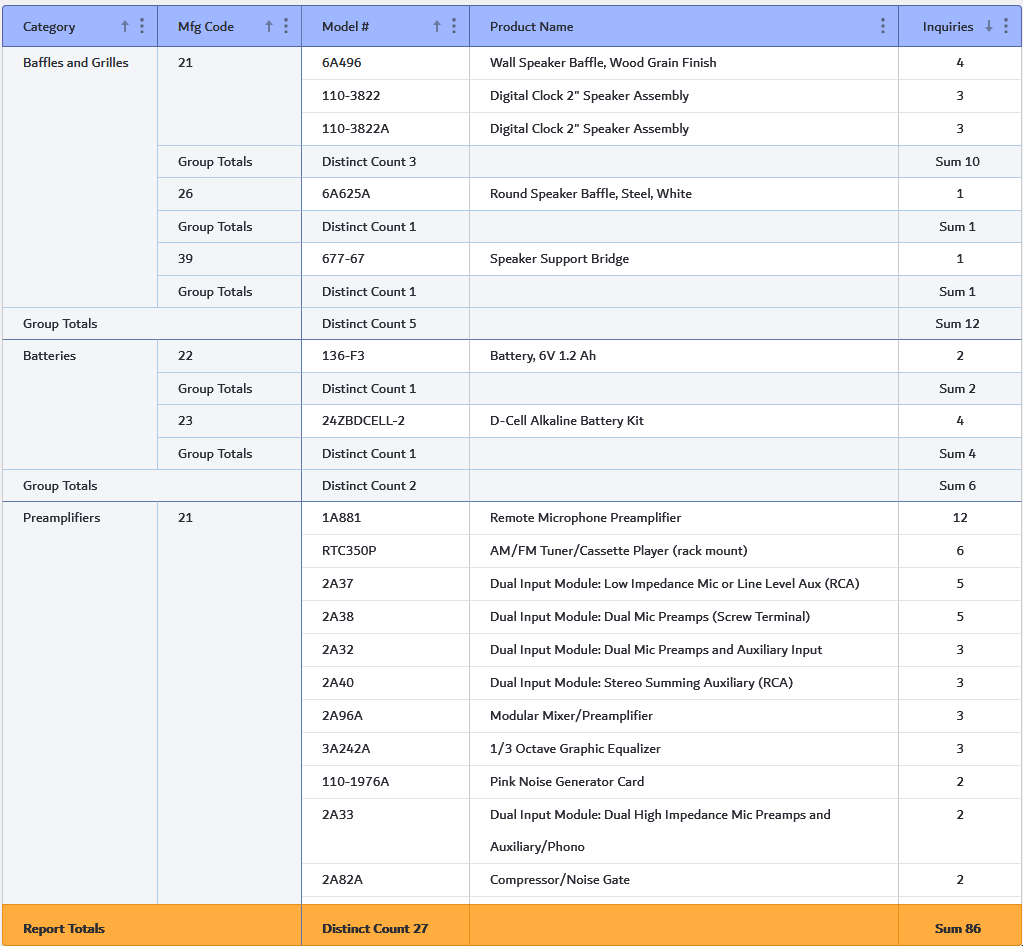
Groups will now appear as individual columns to the left of the data rows.
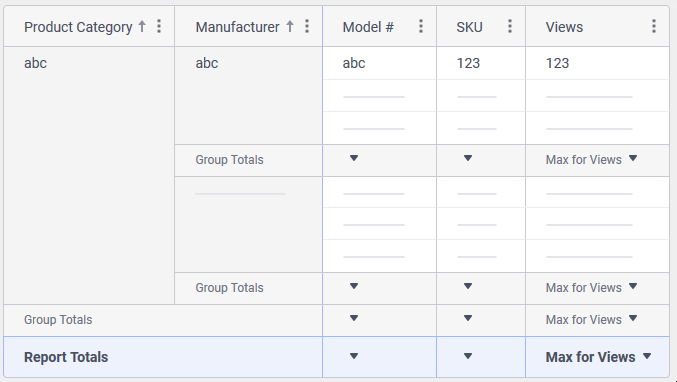
When Details Rows are suppressed, the canvas will rearrange itself to improve layout of summary data.
Quick Functions
Quick Functions are pre-defined calculations or operators that transform the fields in either detail fields or group columns. For example, the Month Name quick function applied to a date column will transform the column to only the name of the month of that date. Quick Functions can be used in lieu of building a full formula column, work in conjunction with a formula, or work on a standard detail field or group column by themselves.
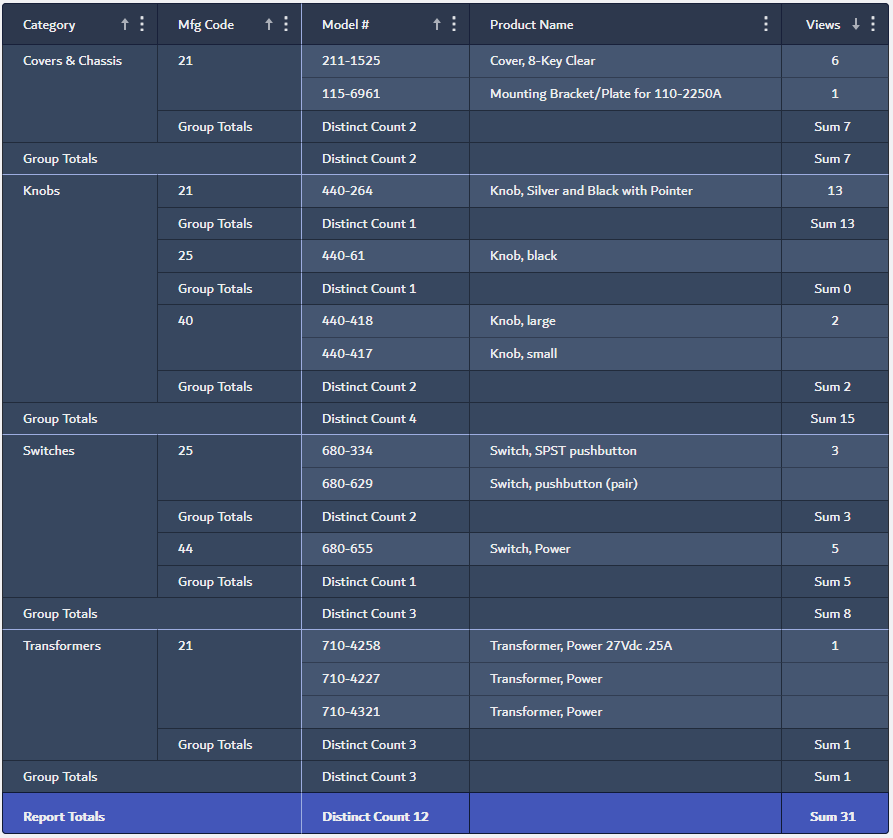
New Themes
A selection of beautiful new WCAG-compliant themes may be applied to ExpressView reports, their charts and exported files. A sampling of ExpressViews with these themes are below:
Advanced Reports
Advanced Report Wizard Removed
The most obvious change when building a new Advanced Report is the removal of the Advanced Report Wizard. Now, when creating a new report, users will be brought directly to the Report Designer and prompted to add Data Objects (formerly known as Categories).
Once users add their Data Objects, they are able to begin designing and building immediately in any order or workflow that suits them.
New Toolbar and Design Grid
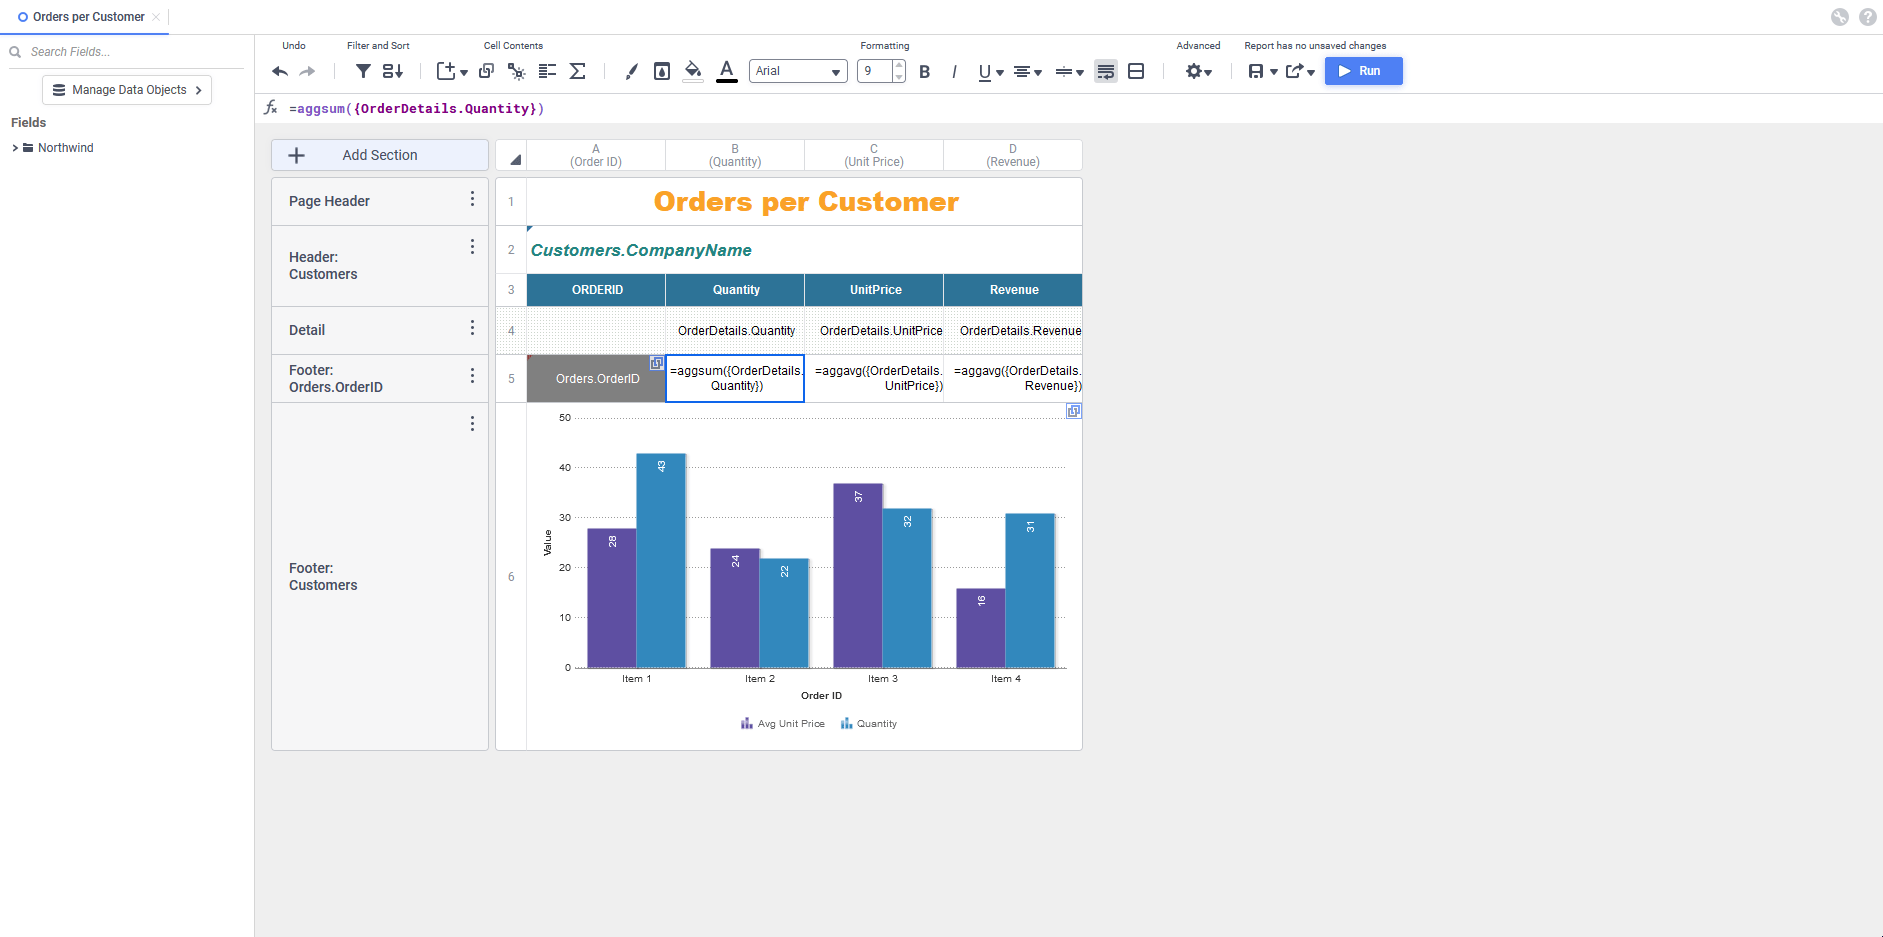
Controls on the toolbar have been re-arranged to make common controls a single-click away. Dedicated icons for Filters  and Sorts
  have been added. A new Insert
 menu consolidates all of the functions that add items to cells—charts, maps, gauges, images, formulas and CrossTabs.
Reports no longer need to be saved before being executed from the Designer. The Rename and Description menu items have been replaced by a new Save  menu that appears in the application’s other designers. A new status message appears above the Save and Run buttons indicating if changes are pending to be saved or not, and a save reminder icon has been added to the navigation tab at the top of the window.

New Add Section and Select All buttons on the design grid make building, formatting and interacting with the grid simpler with fewer clicks. The column and row menus can now be accessed by clicking on a new Column Menu or Row Menu icon on each. Clicking on a row or column header selects all of the cells in that row or column. Clicking and dragging over multiple cells now selects all of the cells. Clicking and dragging on the edge of a cell moves the contents to a new cell.
The Linked Reports dialog now supports searching for reports like the Report Tree does.
New Report Viewer
Like the Designer, the Report Viewer has been given a fresh new look.
Paging controls have been moved to the center of the toolbar, and the former Save User Reports and Clear Changes menus have been combined into a single Edit  menu.
menu.
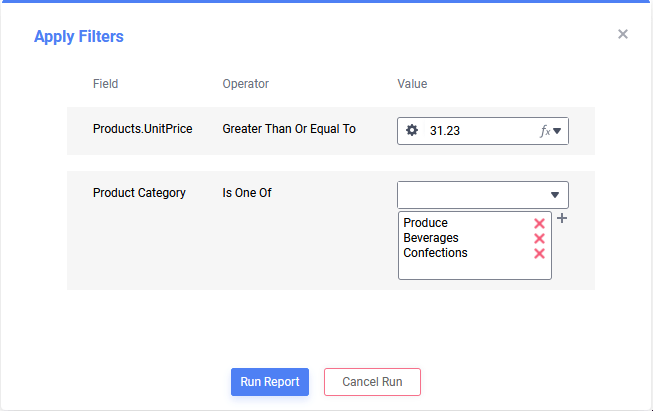
By default, if Filters are set to Prompt with Value, the Simple without Operator Filter Execution Window will be displayed in place of the Standard window. This can be overridden on a report-level or application-level if desired. In addition, the window has been given the same refreshed look as the Report Viewer itself, along with the Simple with Operator and the Prompting Parameters windows.
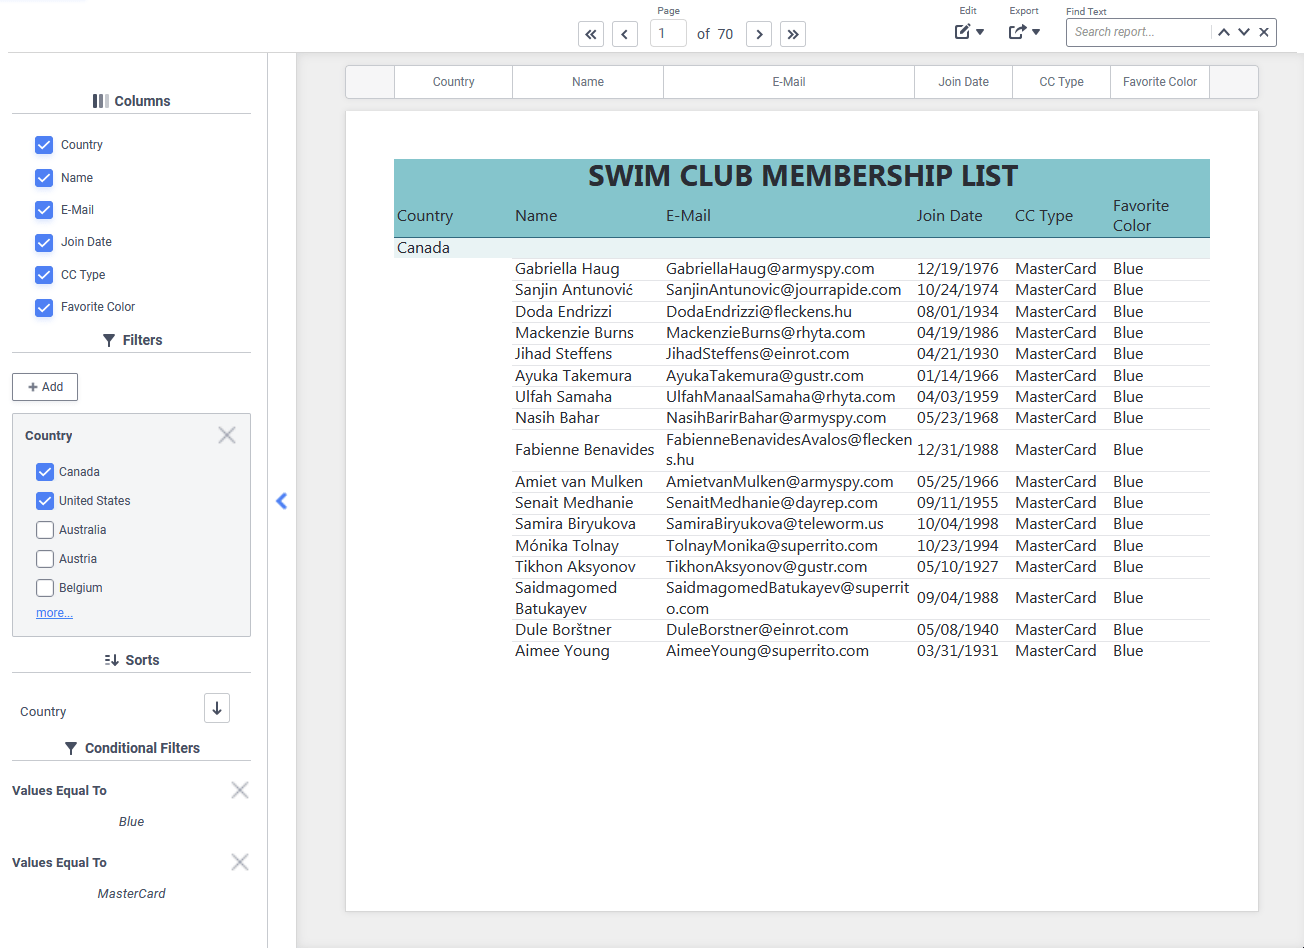
The Interactive Dock containing the Columns, Filters, Sorts and Conditional Filters features has been redesigned and now scrolls as one contiguous unit, showing only the modules that apply to the active report. The Filters module will show more values by default, and selected values appear at the top of the list. A new Open Dock  icon makes the dock easier to find.
Column headers now display prominently at the top of the Report Viewer and are fixed in position, even when scrolling down the page. The headers may be disabled on a report-level with a new Report Viewer Option.

Dashboards
Refresh Reminder in Dashboard Designer
When new reports or visualizations are added to the canvas, or when making changes to existing report or visualization tiles or filters that affect them, they do not automatically query the database and display data. Instead, placeholder data is displayed and a small Refresh Reminder  icon will appear in the tile and on the toolbar’s Refresh icon.
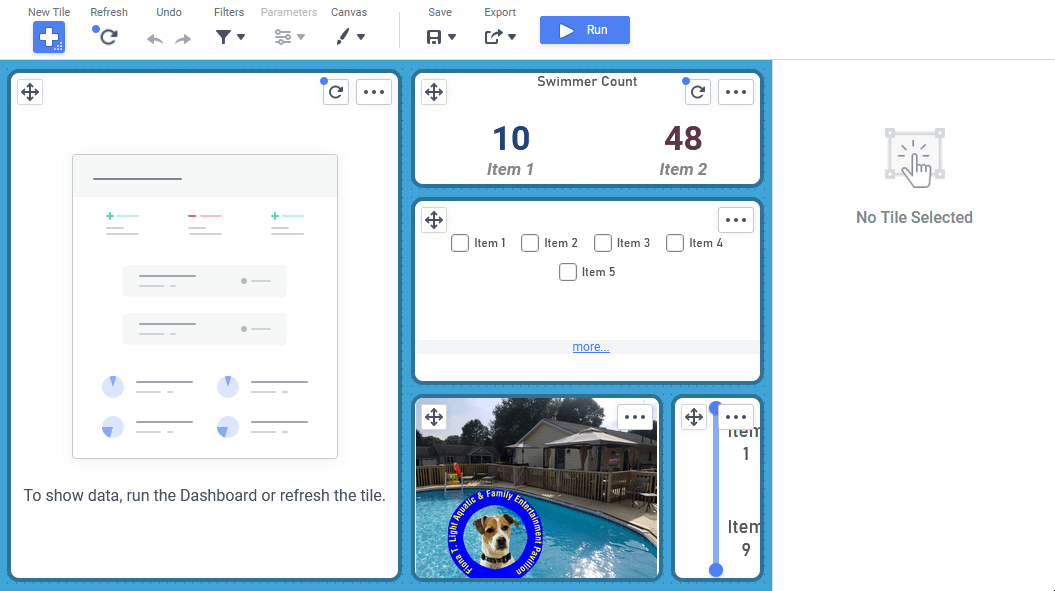
This reduces the load on the data source servers and on the Exago application server, as the reports can be executed once after making a series of changes instead for every single change made.
Interactive Filtering in the Data Source
Dashboards with interactive filters can now pull the interactive filter values from the data source, then execute or re-execute their associated reports with those values in the data source.
This can lead to considerable performance improvements, in some cases going from a couple of minutes of execution time to under ten seconds.
A new setting for Data Objects in the Admin Console allows this behavior to be disabled on a per-object level.
Visualizations
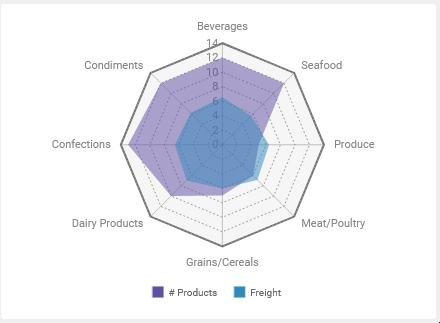
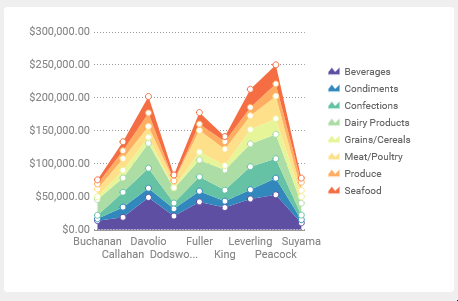
Radar Charts and Stacked Area Charts
Two new chart types: Radar Charts and Stacked Area Charts have been added to the application and are available to ExpressView, Advanced Reports and Dashboards.
New Themes
Like ExpressView, all new WCAG-compliant themes have been added for charts and CrossTabs.
Storage Management
Access Flags
The permission mechanism built-in to the Storage Management system has been updated with a new set of access rights, which have been activated.
- Can Edit
- Can Rename
- Can Share
- Can Delete
- Can Copy
- Can View
- Can Schedule
- Can Move
More information about these flags and how they work can be found in the Permissions section of the Storage Management: Introduction article.
Updated Storage Management Utility
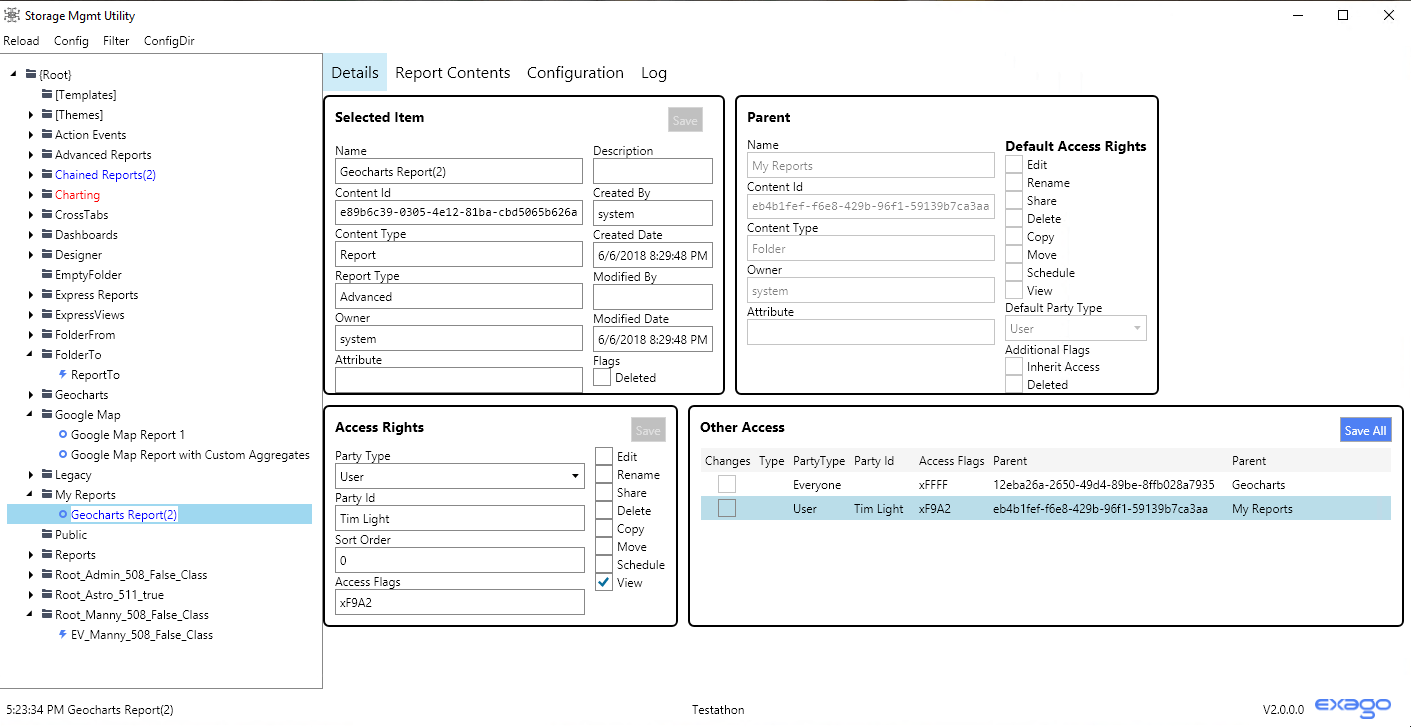
The Storage Management Utility now runs on Windows, Linux and Mac OS X. Content access records for folders, reports, themes and templates can be created, modified and removed directly in the utility.
