Dashboard Designer: Filters (v2019.2+)
The Filters menu in the toolbar is where filters are created, modified or removed, and imported prompting report filters can be modified.
Click on the Filters 
 icon in the toolbar to open the Filters menu. The menu is broken into two sections: Interactive and Imported.
Suggested Reading
A detailed description of how to create filters and how to use them can be found in our Report Designer Filters article.
Interactive Filters
Interactive filters are added in the Dashboard Designer and can be applied to one or more tiles on the canvas. Interactive filters can be displayed on the canvas in tiles where they can be interacted with directly, or are docked in the Filters Pane of the Dashboard Viewer.
An interactive filter displayed as a tile on the canvas
The same interactive filter docked to the Filters Pane instead of appearing on the canvas
Filters with the Equal To, Is One Of or Is Between operator can appear on the canvas in a tile, and have a grab handle  which can be dragged to the canvas to create a tile from the Filters menu. Conversely, filter tiles on the canvas can be dragged into the menu to dock them, or click Dock Filter to Toolbar in the tile’s Tile Menu.
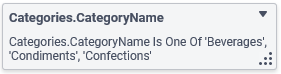
Interactive Filter that is not contained in a canvas tile as it appears in the Filters menu, showing filter field (CategoryName), operator (Is One Of), value (Beverages, Condiments, Confections) and grab handle.
Filters on the canvas only have a basic outline in the menu and don’t show their filter field, operator or value.
Interactive Filter that is contained in a canvas tile as it appears in the Filters menu, showing basic outline
All interactive filters can be docked in the Filters pane. Only filters with the Equal To, Is One Of or Is Between operator can appear on the canvas in a tile.
Filter Dependency
If the Filter Dependency feature is enabled by the system administrator, the filter values available to be selected are determined by the values of other filters on the Dashboard. For example, setting a Category filter would then only show Products in that Category in a separate Products filter.
Dashboard interactive filters are dependent on each other based on the order in which they are added and the reports that they affect.
Here the top filter on Category was added before the one on Product Name below it. Choosing Produce from the top filter changes the bottom tile to only display products in the Produce category. Notice the report is filtered both times the filter values are selected.
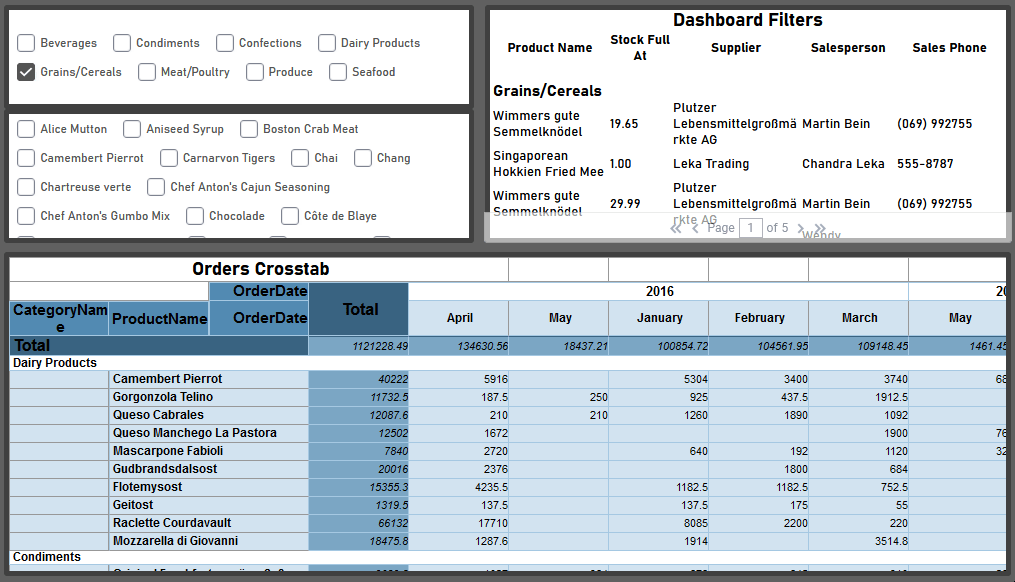
On this Dashboard, the top Category filter is not applied to the large Orders CrossTab tile, so selecting a Category does not filter the Product Names list, since that would remove potential filter values for the CrossTab. However, note that selecting a product from the list that is not a Grain/Cereal will cause the Dashboard Filters report tile to show a No Data Qualified message.
Add an Interactive Filter
To add a filter to the Dashboard, on the Filters menu, click on the  Add Filter button. A New Filter item will appear in the menu. Click on the new filter item to modify it.
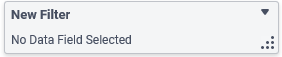
New Filter Item as it appears in the Filters menu
Modify an Interactive Filter
Note
Adding, removing, or modifying the field, formula, operator, or value of an interactive filter or changing the Input Type of an interactive filter on the canvas will require a Refresh of any tiles affected by that filter.
Docked Filters (Not In a Canvas Tile)
An Interactive Filter not contained in a tile is called a Docked Filter. To modify a docked filter, click on the corresponding filter item in the menu and the Filter Item Detail options will appear.
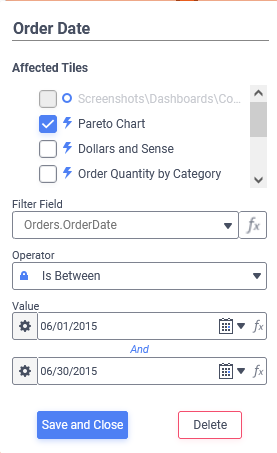
Filter Item Details dialog of the Dashboard Filters menu
Click the corresponding tile names in the Affected Tiles section to apply the filter to the desired tiles. Only those reports containing the Filter Field or a direct relationship to it can be selected even though all of the reports on the Dashboard are available in the list.
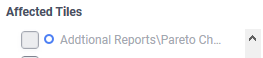
Additional Reports\Pareto Chart does not have a direct data relationship with the Filter Field and is therefore not available
The Interactive Filter can be given a title by clicking on and entering it into the text field at the top of the menu.
Changing title of a docked Interactive Filter from Categories.CategoryName to Category Name
The Filter Field, Operator and Value fields determine what Data Field to filter on, what comparison to make and what value to compare.
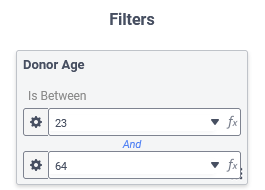
Consider an example where only orders whose Order ID number is larger than 1000 should be included in the tile. The Field is set to Orders.OrderID, the Operator is set to Greater Than or Equal To and the Value is set to 1000.
On the Canvas
Interactive Filters that appear in tiles are modified by clicking on the filter tile and then interacting with the Tile Properties Pane on the right side of the screen.
Content
Filter Field sets the Data Field to filter on. The dropdown list will be populated with fields from the Categories included on the Dashboard as well as those with a direct relationship to those fields. Clicking on the Formula Editor  icon opens the Formula Editor so that a formula can be applied to the Filter Field.
Suggested Reading
The Formulas Section contains an extensive explanation of how to use formulas and what functions are available.
Check the corresponding tile names in the Affected Tiles section to apply the filter to the desired tiles. Only those reports containing the Filter Field or a direct relationship to it can be selected.
Additional Reports\Pareto Chart does not have a direct data relationship with the Filter Field and is therefore not available
The Sort dropdown determines in which order the filter values appear in the tile, either in Ascending or Descending order. For example, if the Filter Field is Employees.LastName, setting this to Ascending will order the last names from A to Z, Descending will order them from Z to A.
Note
The Sort dropdown does not affect the sorting of the data on the reports this filter affects. It only affects the order the filter values are listed in the tile.
An interactive filter in a tile contains a control to interactively change the filter values. Choose the Input Type. The four available control choices are:
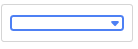
 Dropdown: allows one value to be selected at a time
- Checkboxes: allows zero or more discrete values to be selected simultaneously
- Single Slider: allows one value along a range of values to be selected
- Range Slider: allows all values inside of a range of values to be selected
 Dropdown: allows one value to be selected at a time
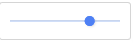 Single Slider: allows one value along a range of values to be selected
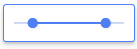 Range Slider: allows all values inside of a range of values to be selected
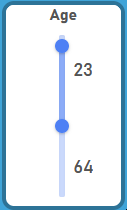
Orientation changes the orientation of the filter tile’s control. Choose from Horizontal or Vertical.
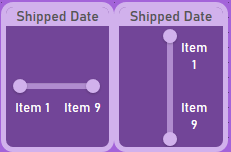
Horizontal and Vertical orientation, respectively, of the same Range Slider control
The Default Value will be used to filter the data when the Dashboard is first run, before the user has interacted with the tile. When the Dashboard is exported as a Chained Report, the Default Value is applied to the tiles.
Style
The Style tab for Filter tiles is further broken down into three areas: Text, Selector Format and Tile.
Text contains typical controls for changing the font type, size, color, styling and alignment for the filter control’s values.
Selector Format section contains controls to set the color, horizontal and vertical alignment of the filter’s control. The Select Format Type dropdown specifies what type of data the filter controls. It works similar to the Number tab of the Cell Formatting window in the Report Designer.
The Tile section is where tile appearance can be changed. The settings here override the Canvas Format defaults.
- Check Background to set a background color for the tile. Click Color to open the color selector and choose a background color. Unchecking the Background checkbox makes the tile transparent.
- Check Tile Header to set a background color for the tile’s header. Click Color to open the color selector and choose a background color. Unchecking the Tile Header checkbox makes the header background transparent.
Note
The Tile Header options are only shown if the Tile Header is visible on the canvas.
- Check Shadow to show a slight shadow effect around the tile.
- Check Border to apply a border to the tile.
- Check Customize Border to set the properties of each of the four tile borders individually. Leave unchecked to have the border properties applied equally to the four sides.
- Click Color to open the color selector and choose a border color.
- Width sets the border width in pixels.
- Round sets the roundness of the corners.
Advanced
The Advanced tab is not available for Filter tiles.
Delete an Interactive Filter
Docked Filters (Not In a Canvas Tile)
To delete an Interactive Filter from the Dashboard:
- Click on the Filters icon in the toolbar to open the Filters menu.
- Click on the desired filter item in the menu.
- Click the Delete button at the bottom of the Filter Item Detail.
On the Canvas
Click the Interactive Filter tile on the canvas, then click Delete Tile from the Tile Menu.
Exports
Interactive filter tiles will not appear in the resulting Chained Report when a Dashboard is exported. Though the tiles themselves will not display, the default values set for the filters will apply to their affected tiles in the exported file.
In PDF Snapshot exports (v2021.2+), filter tiles show a summary of the field, operator and values in place of their controls.
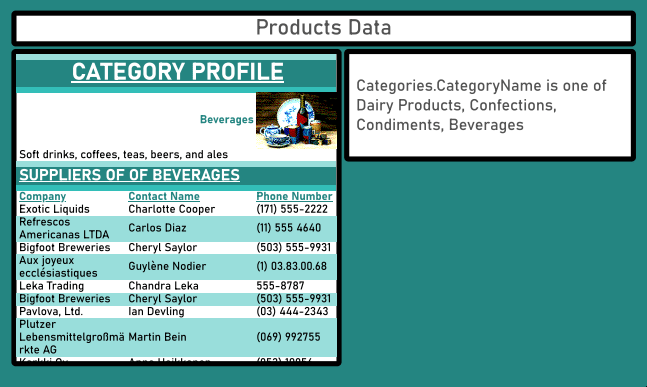
Snapshot of a simple Dashboard showing the values Dairy Products, Confections, Condiments and Beverages selected for the Categories.CategoryName filter tile
Refer to the Exporting Dashboards article for more information.
Imported Filters
When an existing report is added to the Dashboard and it contains prompting filters, those filters are imported into the Dashboard.
When more than one report is added with a prompting filter on the same Data Field, the filters will be automatically combined into a single consolidated imported filter.
Add an Imported Filter
A report added to the Dashboard that contains prompting filters will import those filters automatically.
Modify an Imported Filter
To modify an Imported Filter click on the corresponding filter item in the Filters menu. The Filter Item Detail will appear.
Filter Item Detail
The Imported Filter can be given a title by clicking on and typing it into the text field at the top of the menu.
Changing title of an Imported Filter from Categories.CategoryName to Category Name
The Operator and Value fields determine what comparison to make and what value to compare.
Note
To edit the filter field of an Imported Filter, edit the corresponding report in the Report Designer.
The Affected Tiles section lists the tiles which are affected by this filter. If more than one report is filtered by the same Filter Field, it is grouped together into a Consolidated Filter. This consolidation happens automatically. There can only be one consolidation for a single data field on a Dashboard.
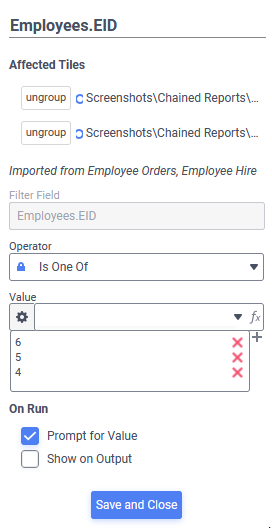
Filter Details of a Consolidated Filter
When imported filters are consolidated, changing the Operator or Value will change it for all of the Affected Tiles simultaneously. To break the consolidation so that tiles may have their operators and values set individually, click the corresponding Ungroup button.
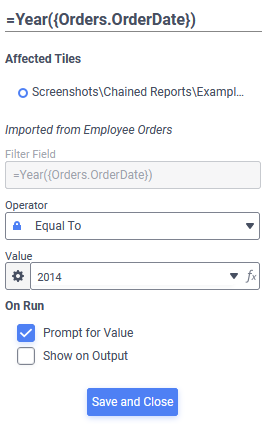
The On Run options work as follows for both consolidated and unconsolidated filters:
- Prompt for Value when checked will prompt the user to specify a filter value when the Dashboard Viewer is launched
- Show on Output when checked will show the filter in the Dashboard Viewer‘s Filter Pane. If unchecked, the filter will be hidden from the Filter Pane but will still affect the reports.
Delete an Imported Filter
To remove an Imported Filter from a Dashboard, it must be set to not prompt for a value or be removed from the report where it was imported from.
