-
Reporting
-
-
- Advanced Options
- Advanced Reports: Categories (pre-2021.1)
- Advanced Reports: Design Grid (pre-2021.1)
- Advanced Reports: Joins
- Advanced Reports: Report Designer (pre-2021.1)
- Advanced Reports: Report Options
- Advanced Reports: Sections (pre-v2021.1)
- Advanced Reports: Sorts
- Advanced Reports: Using the Toolbar (pre-v2021.1)
- Cell Formatting
- Report Wizard
- Report Wizard: Categories
- Report Wizard: Filters
- Report Wizard: Layout
- Report Wizard: Name
- Report Wizard: Options
- Report Wizard: Sorts
- Show all articles ( 7 ) Collapse Articles
- Advanced Reports: CrossTabs
- Advanced Reports: Templates
- Building Your First Report
- Chained Reports
- Conditional Row Suppression
- Dealing with Duplicate Values
- Display Page Numbers
- Filters
- Keyboard Shortcuts
- Linked Reports (Drilldowns)
- Navigating the Application
- No Data Qualified Options
- Report Types
- Report Viewer
- Sorting by Aggregates
- User Preferences and Context Sensitive Help
- Show all articles ( 6 ) Collapse Articles
-
-
- Chart Advanced Features: Area
- Chart Advanced Features: Bar 2D
- Chart Advanced Features: Bar 3D
- Chart Advanced Features: Bubble
- Chart Advanced Features: Column 2D
- Chart Advanced Features: Column 3D
- Chart Advanced Features: Combination 2D
- Chart Advanced Features: Combination 3D
- Chart Advanced Features: Doughnut 2D
- Chart Advanced Features: Doughnut 3D
- Chart Advanced Features: Funnel
- Chart Advanced Features: Heatmap
- Chart Advanced Features: Line
- Chart Advanced Features: Pareto 2D
- Chart Advanced Features: Pareto 3D
- Chart Advanced Features: Pie 2D
- Chart Advanced Features: Pie 3D
- Chart Advanced Features: Pyramid
- Chart Advanced Features: Radar
- Chart Advanced Features: Samples
- Chart Advanced Features: Scatter
- Chart Advanced Features: Spark Column
- Chart Advanced Features: Spark Line
- Chart Advanced Features: Spline
- Chart Advanced Features: Spline Area
- Chart Advanced Features: Stacked Area
- Chart Advanced Features: Stacked Bar 2D
- Chart Advanced Features: Stacked Bar 3D
- Chart Advanced Features: Stacked Column 2D
- Chart Advanced Features: Stacked Column 3D
- Chart Advanced Features: Zoom Line
- Chart Advanced Features: Zoom Scatter
- Show all articles ( 22 ) Collapse Articles
- Bar Charts
- Chart Data Layout Types
- Charts and the Chart Wizard
- Displaying Null Values in Charts
- Gauges
- GeoCharts
- Google Maps
- Heatmap Charts
- Key Performance Indicator (KPI)
- Line Charts
- Pareto Charts
- Pie, Doughnut, Pyramid, and Funnel Charts
- Scatter and Bubble Charts
- Spark Charts
- Tabular Visualizations
- Show all articles ( 5 ) Collapse Articles
-
-
-
- Dashboard Designer (v2019.2+)
- Dashboard Designer: Existing Report Tiles (v2019.2+)
- Dashboard Designer: Filters (v2019.2+)
- Dashboard Designer: Image Tiles (v2019.2+)
- Dashboard Designer: Parameters (v2019.2+)
- Dashboard Designer: Samples (v2019.2+)
- Dashboard Designer: Text Tiles (v2019.2+)
- Dashboard Designer: URL Tiles (v2019.2+)
- Dashboard Designer: Visualization Tiles (v2019.2+)
- Dashboard Viewer (v2019.2+)
- Exporting Dashboards (v2019.2+)
- Show all articles ( 1 ) Collapse Articles
-
-
- ExpressView: Aggregating/Summarizing Data (v2021.1+)
- ExpressView: Exporting (v2021.1+)
- ExpressView: Filtering (v2021.1)
- ExpressView: Formula Columns (v2021.1+)
- ExpressView: Grouping (v2021.1+)
- ExpressView: Introduction (v2021.1+)
- ExpressView: Sorting (v2021.1+)
- ExpressView: Visualizations (v2021.1+)
-
-
- Aggregate Functions
- Arithmetic and Geometric Functions
- Database and Data Type Functions
- Date Functions
- FilterValue and General Format Best Practices
- Financial Functions
- Formatting Functions
- Formula Editor
- Internal Parameters
- JSONExtract Function
- List of Functions
- Logical Functions
- Other Functions
- String Functions
- What are formulas?
- Show all articles ( 5 ) Collapse Articles
-
-
Administrators
-
- Advanced Joins
- Amazon S3 File Storage
- Application Settings
- Automatic Database Discovery
- CData Drivers
- Config File XML & API Setting Reference (General Nodes)
- Config File XML Reference (All Nodes but General)
- Configuring Remote Report Execution Host for Azure App Service Deployments
- Considerations When Sizing an Exago System
- Database Aggregation
- Evaluating Exago - Linux
- Evaluating Exago - Windows
- Exago Installation Manifest
- Execution Caching
- Exploring Exago Technology
- Hidden Flags
- Inline Frame or JavaScript API?
- Installing and Configuring the REST Web Service API
- Installing Optional Features
- Managing the dbconfigs.json File
- Manual Application Installation
- Moving Files Between Storage Management Databases
- Multi-Tenant Environment Integration
- Multiple Data Models
- Report-Level SQL Objects
- Scheduling Reports
- Security Checklist
- Set Up Exago in a Web Farm
- Step 1: Install and Configure
- Step 2: Integrate
- Step 3: Install and Configure the Scheduler Service
- Step 4: Administration Console and API
- Step 5: Extensions
- Storage Management: Custom Implementation
- Storage Management: Database Schema
- Storage Management: Getting Started
- Storage Management: Introduction
- Storage Management: Transitioning from Legacy Storage Methods
- Storage Management: Utility (v2020.1)
- Storage Management: Utility (v2021.1+)
- Table-Valued Functions
- Technical Specifications
- User Identification
- Using SQLite Data Sources
- Vertical Table Support
- Windows Registry Changes
- Show all articles ( 36 ) Collapse Articles
-
- What's New in Version 2021.2
- Performance Enhancements in Version 2019.1
- Support and Maintenance Policy
- Time Zone Calculation Enhancements in v2019.1
- Updating Recommendations
- Updating to the Latest Version (Potentially Breaking Changes)
- What's New in Version 2019.1
- What's New in Version 2019.2
- What's New in Version 2020.1
- What's New in Version 2021.1
-
- Constants and Enumerators
- Executing Reports with the API
- List of REST Endpoints
- REST - Batch
- REST - Config Settings
- REST - Data Joins
- REST - Data Objects
- REST - Data Sources
- REST - Folders
- REST - Functions
- REST - GetExecute
- REST - Getting Started
- REST - Introduction
- REST — Parameters
- REST - Role Security
- REST - SchedulesV2
- REST - Server Events
- REST - Sessions
- REST - Storage Management
- REST Updates
- Using JSON
- Show all articles ( 11 ) Collapse Articles
-
- .NET API Documentation
- .NET API General Reference
- .NET Sample Code
- Constants and Enumerators
- Introduction to the .NET API
- List of .NET API Resources
- Load Reports in the .NET API
- Supply SQL for New Reports in the API
- Using the Administration Console and Exago API
- WebReports.Api
- WebReports.Api.Common
- WebReports.Api.Composite.Chained
- WebReports.Api.Composite.Dashboards
- WebReports.Api.Data
- WebReports.Api.Reports
- WebReports.Api.Roles
- WebReports.Api.Scheduler
- WebReportsDebug.xml
- Show all articles ( 8 ) Collapse Articles
-
- Configuration File Options and Optimizations
- High Availability
- Incremental Loading
- Intro to Performance and Scaling
- Measuring Database Network Latency
- Monitoring Database Schema
- Monitoring Scheduler Load
- Monitoring: Setup
- Monitoring: System Overview
- Special Cartesian Processing
- Tracking Execution Frequency with Monitoring
- Show all articles ( 1 ) Collapse Articles
-
- Adding Custom Items to the Report Tree
- Adding Fonts to Exago
- An Overview of Exago Extensions
- Application Themes
- Assembly Data Sources
- Create a Custom ExpressView Theme
- Create a Custom ExpressView Theme (v2021.1+)
- Custom Context Sensitive Help
- Customizing Getting Started Content
- Displaying User Messages
- Exago Theme Maker
- Excel: Grouping on Separate Worksheets
- Getting Started with Application Themes
- HTML Tag Sanitization
- Multi-Language Support
- Remote Execution
- Report and Folder Storage/Management
- Scheduler Queue
- SessionInfo
- Styling Exago
- Styling the Home Page
- Themes
- Show all articles ( 12 ) Collapse Articles
-
- Global Event: OnAfterLoadReportsList
- Global Event: OnAfterReportExportSuccess
- Global Event: OnConfigLoadEnd
- Global Event: OnConfigLoadStart
- Global Event: OnDataCombined
- Global Event: OnDataFieldsRetrieved
- Global Event: OnExceptionThrown
- Global Event: OnExecuteSqlStatementConstructed
- Global Event: OnExportCsvCell
- Global Event: OnFilterSqlStatementConstructed
- Global Event: OnGetUserPreferences
- Global Event: OnLoadReportParameters
- Global Event: OnOkFiltersDialog
- Global Event: OnOkParametersDialog
- Global Event: OnParameterSqlStatementConstructed
- Global Event: OnRenameFolderEnd
- Global Event: OnRenameFolderStart
- Global Event: OnReportExecuteEnd
- Global Event: OnReportExecuteInit
- Global Event: OnReportExecuteStart
- Global Event: OnReportFailValidation
- Global Event: OnReportSaveStart
- Global Event: OnScheduledReportComplete
- Global Event: OnScheduledReportExecuteStart
- Global Event: OnScheduledReportExecuteSuccess
- Global Event: OnSetUserPreferences
- Global Event: OnWebServiceExecuteEnd
- Introduction to Server Events
- List of Server Events
- Show all articles ( 19 ) Collapse Articles
-
-
How To
-
- .NET and REST APIs
- Batch REST API
- Custom Aggregate Functions
- Custom Columns and CrossTabs
- Custom Dialogs
- Custom Filter Functions
- Custom Functions
- Custom Interactivity via HTML & Action Events
- Customizing Color Picker
- Dashboard Updates in v2021.1
- Data Formatting
- Date Check Custom Functions
- Dynamic Rank Custom Function
- Filters
- Folder Management
- High Availability
- JavaScript API
- JavaScript API Filters
- Joins for Admins
- Linux Installation
- Multi-Tenanting
- Multiple Data Models, Cloned Data Objects & Vertical Tables
- Parameters
- REST Web Service API Setup & Security
- Roles
- Scheduler Configuration
- Security Settings
- Server Events
- Share by Link
- Storage Management Customization
- Storage Management Migration
- Storage Management Overview
- Storage Management Permissioning
- Stored Procedures
- Time Zone Handling
- Troubleshooting for Admins
- Upgrading
- v2018.2 User Preferences
- v2019.1 Configuration Changes
- v2019.1 Small Enhancements
- Visual Integration and Localization
- Show all articles ( 31 ) Collapse Articles
-
- User Support Lab - 3D Charts
- User Support Lab - Advanced Grouping
- User Support Lab - Chained Reports
- User Support Lab - Chart Data Layouts
- User Support Lab - Complete Report Design
- User Support Lab - Conditional Formatting
- User Support Lab - Crosstab Reports
- User Support Lab - Dashboards v2019.2
- User Support Lab - ExpressView
- User Support Lab - Filter by Formula
- User Support Lab - Filters
- User Support Lab - Formatting Tips and Tricks
- User Support Lab - Formulas
- User Support Lab - Formulas in ExpressView
- User Support Lab - Interactive Reports
- User Support Lab - Joins for Report Writers
- User Support Lab - Key Performance Indicators (KPIs)
- User Support Lab - Linked Reports a.k.a Drilldowns
- User Support Lab - Mapping
- User Support Lab - Multi-Series Charts
- User Support Lab - New Features v2018.2
- User Support Lab - No Data Qualified
- User Support Lab - Repeating Data
- User Support Lab - Report Scheduler
- User Support Lab - Report/SQL Relationship
- User Support Lab - Templates
- User Support Lab - Themes
- User Support Lab - Train the Trainer
- User Support Lab - Train the Trainer Advanced Reports
- User Support Lab - Train the Trainer ExpressView
- User Support Lab - Using ExpressView as a Data Discovery and Troubleshooting Tool
- Show all articles ( 21 ) Collapse Articles
-
- Adding a SQL Datasource
- Configuring a Stored Procedure Pt 1
- Configuring a Stored Procedure Pt 2
- Configuring a Table or View Pt 1
- Configuring a Table or View Pt 2
- Configuring IIS
- Configuring the REST Web Service [Linux]
- Configuring the REST Web Service [Windows]
- Configuring the Scheduler [Linux]
- Configuring the Scheduler [Windows]
- Installing Exago on Linux [Apache]
- Installing Exago on Linux [NGINX]
- Installing Exago on Windows
- Installing REST [Linux]
- Installing REST [Windows]
- Installing the Scheduler [Linux]
- Installing the Scheduler [Windows]
- Integration Example
- Introduction to Technical Training Series
- Programmable Object Settings
- Roles
- Storage Management Permissioning and Setup
- Show all articles ( 12 ) Collapse Articles
-
- Basic Training 01. Introduction
- Basic Training 02. ExpressView
- Basic Training 03. Advanced Reports
- Basic Training 04. Sections
- Basic Training 05. Formatting
- Basic Training 06. Formulas
- Basic Training 07. CrossTab Reports
- Basic Training 08. Charts
- Basic Training 09. Filters
- Basic Training 10. Conditional Formatting
- Basic Training 11. Dashboards
- Basic Training 11a. Dashboard Visualizations
- Basic Training 12. Practice Exercises
- Show all articles ( 3 ) Collapse Articles
-
-
Resources
ExpressView: Introduction
Notice
This article applies to the ExpressView Designer in pre-v2021.1. For v2021.1+, refer to the ExpressView: Introduction (v2021.1+) article.
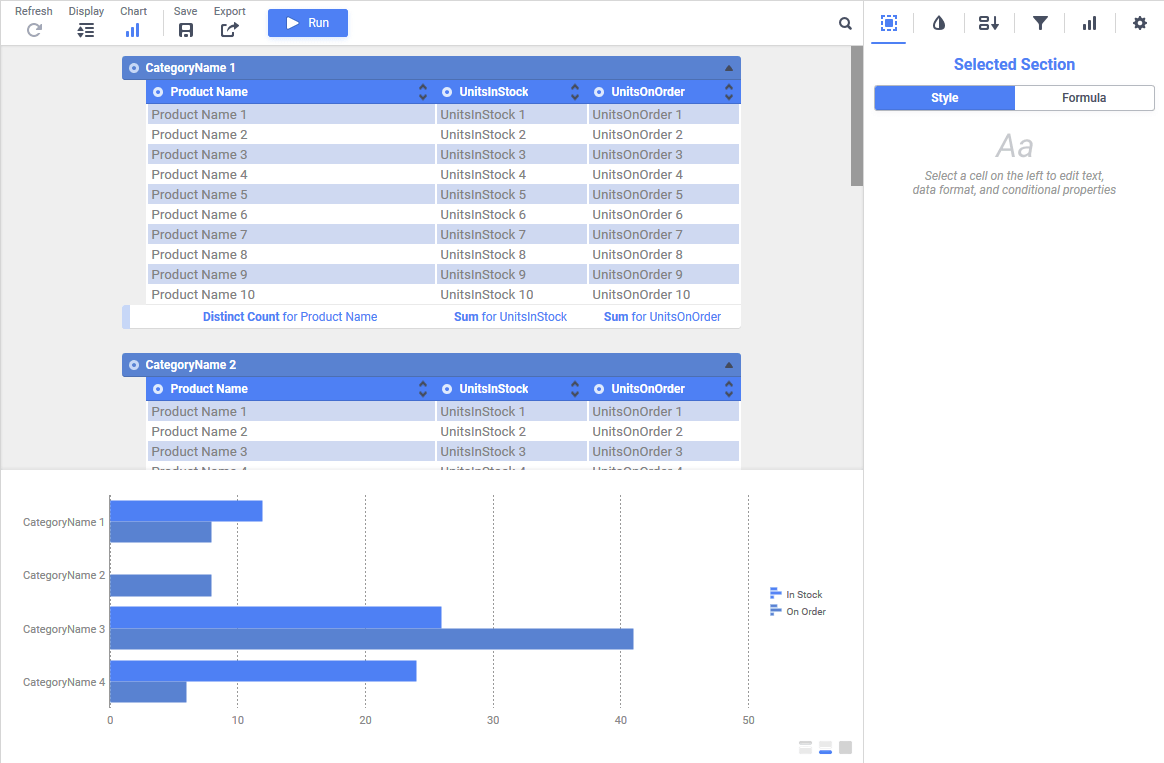
The ExpressView Designer is a data discovery tool that simplifies grouping, sorting, filtering, and aggregating data with a drag-and-drop interface. A chart can be added with a single click, and ExpressViews can be styled and saved as PDF, RTF, CSV, or Excel files.
Making an ExpressView
ExpressView allows you to quickly see data and make reports without concern for the minutiae of old-fashioned report building.
To make an ExpressView:
-
Click the Create New Report
 icon and select ExpressView.
The ExpressView Designer is divided into the Data pane on the left, and the Design pane in the middle. The Data pane comprises all of your accessible data categories, containing groups of related data fields. Click the Choose Data
icon to expand or collapse the Data pane. - Expand a category by clicking the arrow icon. This shows the fields in that category.
- Drag a field onto the Design pane to add it to the ExpressView. This expands the field into a data column. It will only show placeholder data initially.
Dragging a field onto the Design pane -
Continue to add fields as desired. Fields can be added or removed at any time.
Note
As you add fields, unrelated fields will become unavailable. To learn about how fields relate to each other, see Joins.
- When you are satisfied with your data selection, click to populate the ExpressView with data. You can now page through your data using the navigation icons in the toolbar.
Truncated results displayed
This icon and message indicates that the report has only returned a partial data set. There are fewer detail rows than the full set, and aggregate formulas and visualizations apply only to the data that was returned to the report.To retrieve more data, click the icon and select either:
- Generate +number to get the next number of data rows and add them to the existing report.
- Generate All to get the full data set.
- Click the Save icon to save the ExpressView. In the Settings window, enter a Name and select a folder where it should be stored. Then click Save Report Info.
 icon and select
  ExpressView.
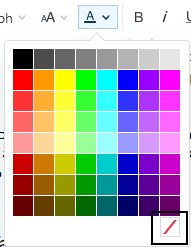 icon to expand or collapse the Data pane.
 icon. This shows the fields in that category.
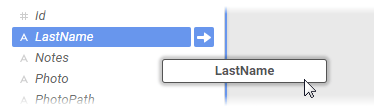
 to populate the ExpressView with data. You can now page through your data using the navigation icons


 in the toolbar.
 Truncated results displayed
 icon to save the ExpressView. In the Settings window, enter a Name and select a folder where it should be stored. Then click Save Report Info.
These steps illustrate how quick it is to make a tabular report from scratch using ExpressView. But ExpressView can be more than just basic reports. You can make groups, charts, calculations, and customize the look of the report. And it is all designed to be easy to use. The articles in this section will describe how to use these powerful features.
To switch off the data view and revert back to design view, click  in the toolbar.
About the Radial Menu
Throughout this article you will see references to a menu called the Radial Menu. The Radial Menu is a menu of options for each data column and group, which is accessed by clicking the colored Radial  icon on the top left of the column or group.
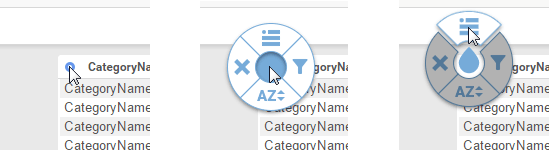
Each radial menu has four options, arranged in a circle around the center. When you are prompted to select a radial menu option, you will be asked to “use radial>direction“. Direction is one of the four cardinal directions corresponding with one of the four options: left, right, up, down.
For example, “use radial>left” means to open the radial menu and select the left option. To do this, you have two options:
- Click the radial icon, move your cursor left, then click again.
- Click-and-hold the radial icon, drag your cursor left, then release.
To close the radial menu without selecting an option, click in the center.
Interactive Editing
With the introduction of interactive editing to ExpressView in v2018.2, you can customize your report by simply right-clicking on the desired section while in design or live mode.
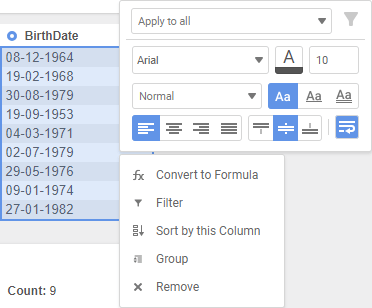
Right-click options include all of the capabilities of the radial menu, conditional filters, and formatting options such as text alignment, font type, and font color.
Conditional Selector Dropdown
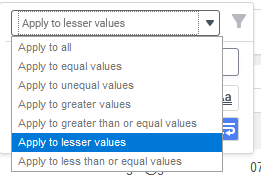
The Conditional Selector dropdown allows you to conditionally select certain values in the column you’ve right-clicked: Apply to all, Apply to equal values, Apply to unequal values, Apply to greater values, Apply to greater than or equal values, Apply to lesser values or Apply to less than or equal values. This choice will then select the applicable values in the column so changes to the formatting options will only affect them.
If the system administrator has enabled editing ExpessView with Live Data, changing the dropdown will enable the Create Filter  icon. Clicking the icon creates a filter in the Filter Pane based on the value that was right-clicked and the condition in the dropdown. For example in the figure above, right-clicking on 08-12-1964 and selecting Apply to unequal values creates a new filter on the BirthDate field with an Is Not Equal To operator and the value 08-12-1964.
Note
Saving the ExpressView will save any filters created with the Create Filter
0 out of 5 stars
| 5 Stars | 0% | |
| 4 Stars | 0% | |
| 3 Stars | 0% | |
| 2 Stars | 0% | |
| 1 Stars | 0% |
