Aggregate Functions
Aggregate Functions calculate values based on two factors: the input cell, which is usually but not always a data field, and the report section that the function is located, relative to the input. The location of the function determines which, and how many cell values will be sent to the input. For example, an AggCount() function in a Group Footer will count the values in the group, but that same function in a Report Footer will count the values for the entire report. Aggregate Functions can also be used in Group Headers.
Note
Aggregate Functions cannot be nested, used in conditional formulas, in the static sections of a report or ExpressView formula columns.
Aggregating One-to-Many Relationships
Aggregate Functions have an optional argument that indicates how to count aggregates for one-to-many relationships named recordLevel. This argument indicates whether aggregation should occur at the record level or entity level. Pass True() to force aggregation to occur for every record, regardless of whether or not the record represents a unique instance of the entity that is being aggregated. This is called record level aggregation.
By default aggregation occurs only for every unique instance of the entity being aggregated, not for repeat values that occur from a one-to-many data relationship.
For example, in the two reports below, the Category Name column is being aggregated with the AggCount() function. The top figure aggregates on the entity level (recordLevel argument is False), and the bottom figure aggregates on the record level (recordLevel argument is True). Since the Category Name does not change, when aggregating by entity level, the count is 1. When aggregating on the record level, all records are considered for the aggregation and the count is 11.
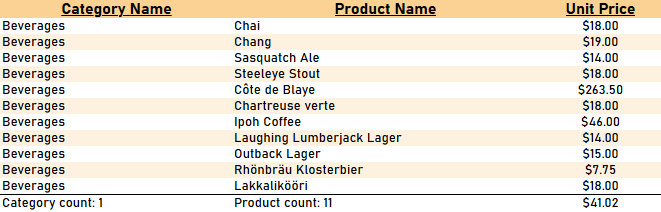
Aggregating CategoryName on entity level (recordLevel is False)
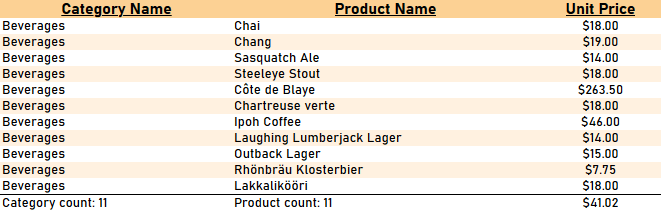
Aggregating CategoryName on record level (recordLevel is True)
Most users can choose to ignore this option by simply omitting the argument.
To count at the Entity level, the application checks for changes in the Unique Key Fields of the object on the one- side of the join. Therefore, it is important to sort the report by the one– side’s unique key fields, otherwise the result is undefined and may be nonsensical.
In application v2019.2, an administrator can add their own aggregate functions to the application, called a Custom Aggregate Function. Consult with your administrator for more details about what functions are available when building reports.
Note
The application will not include
nullvalues when aggregating in-memory. If the system administrator has enabled aggregation in the data source, the data source will determine hownullvalues are handled during aggregation.
AggAvg
| Description | Returns the average of the values in a group. |
|---|---|
| Remark |
Accepts data fields or cell references.
Due to a limitation in Google BigQuery Data Sources, calculating the aggregate average on a floating point column may cause non-deterministic results. |
| Example | AggAvg({OrderDetail.Quantity})returns the average quantity of sales orders. |
AggCount
| Description | Returns the number of unique entities in a Data Object. |
|---|---|
| Remark |
The AggCount() function uses the Data Object, not the Data Field. For example, the function When passing a cell reference, the function will count the rows in the group section, not the rows in the data object. See the example below. Optional second argument indicates whether to count:
|
| Example | Consider this sample report that displays all of the products in each category. Cell B3‘s formula =AggCount({Categories.CategoryName}) will count the number of times a product has an associated category name (in this example, that is all of the products). However, cell C3‘s formula =AggCount([A1]) will count the number of categories in the header section.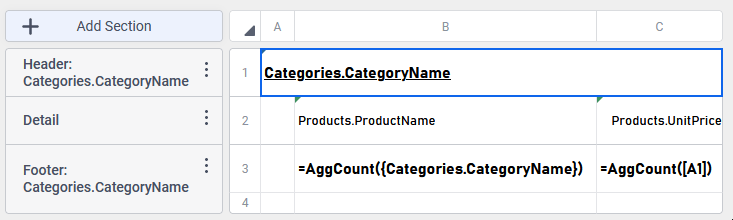 Therefore, the expected report output should look like this: 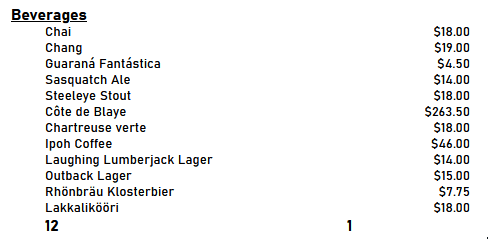 Where 12 is the number of products by virtue that they are all associated with the Beverages category, and 1 is the number of product categories referenced by cell A1. |
AggDistinctCount
| Description | Returns the number of unique values in a group. |
|---|---|
| Remark |
Accepts data fields or cell references. Optional second argument indicates whether to count:
Optional third argument indicates whether to count
|
| Example | AggDistinctCount({OrderDetail.Quantity})returns the number distinct quantities in an order. |
AggMax
| Description | Returns the maximum value in a group. |
|---|---|
| Remark |
Accepts data fields or cell references.
|
| Example | AggMax({OrderDetail.Discount})returns the largest discount. |
AggMin
| Description | Returns the minimum value in a group. |
|---|---|
| Remark |
Accepts data fields or cell references.
|
| Example | AggMin({OrderDetail.Discount})returns the smallest discount. |
AggSum
| Description | Returns the sum of the values in a group. |
|---|---|
| Remark |
Accepts data fields or cell references.
Due to a limitation in Google BigQuery Data Sources, calculating the aggregate sum on a floating point column may cause non-deterministic results. |
| Example | AggSum({OrderDetail.Quantity})returns the total quantity of units ordered. |
RunningSum
| Description | Returns a running total of the input cell. |
|---|---|
| Remark |
The cell you want to sum. Optional second argument of a Data Field or Category. The running sum will reset to 0 whenever there is a new value for this Data Field or Category. Optional third argument indicates whether to count:
|
| Examples |
|
AggMedian v2017.2+
| Description | Returns the median, or the middle value, of a data set. |
|---|---|
| Remark |
Accepts data fields or cell references. Optional second argument indicates whether to count:
|
| Example | AggMedian({OrderDetail.Quantity})returns the median order quantity. |
AggMode v2017.2+
| Description | Returns the mode, or the value that appears most often, of a data set. |
|---|---|
| Remark |
Accepts data fields or cell references. Optional second argument indicates whether to count:
|
| Example | AggMode({OrderDetail.Quantity})returns the mode of order quantity. |
AggStandardDeviation v2017.2+
| Description | Returns the standard deviation (SD) of a data set. SD is used to quantify the spread of the values in a data set. A lower SD indicates that values are close to the mean, and a higher SD indicates that values are more spread. |
|---|---|
| Remark |
Accepts data fields or cell references. Takes one, two, or three arguments: The cell to get the standard deviation Optional second argument indicates whether to calculate:
Optional third argument indicates whether to count:
|
| Example | AggStandardDeviation({OrderDetail.Quantity})returns the standard deviation of order quantities. |
AggVariance v2017.2+
| Description | Returns the variance of a data set. Variance is used to quantify the spread of the values in a data set, and is equal to the square of the standard deviation. Variance weighs outliers more heavily than standard deviation. |
|---|---|
| Remark |
Accepts data fields or cell references. Takes one, two, or three inputs: The cell to get the variance Optional second argument indicates whether to calculate:
Optional third argument indicates whether to count:
|
| Example | AggVariance({OrderDetail.Quantity})returns the variance of order quantities |
