Dashboard Designer (v2019.2+)
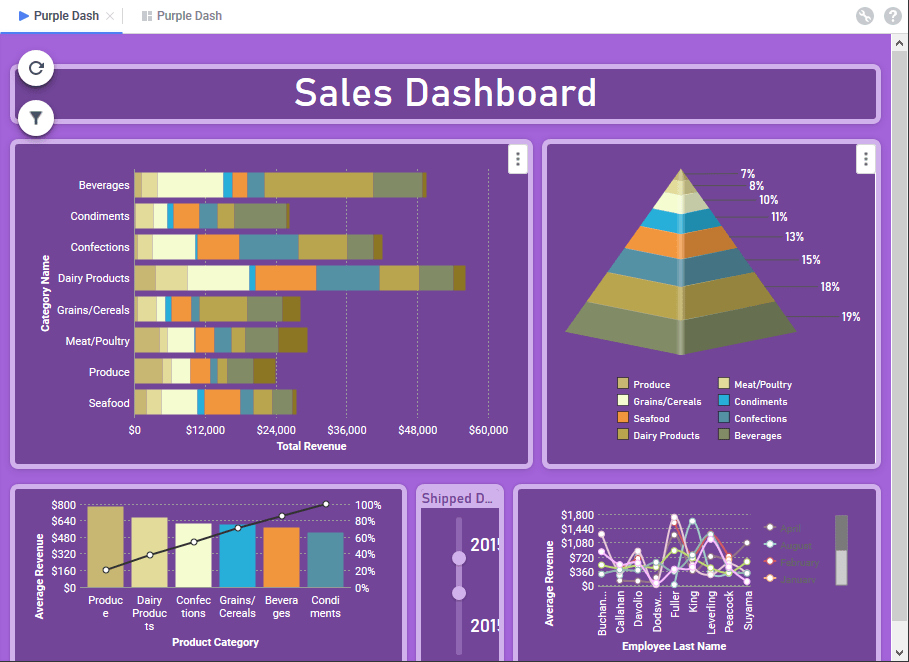
Dashboards are a way to combine several related reports into one unified viewing space. Existing reports can be added to a Dashboard, and new Visualizations can be created directly on the Dashboard itself. Images, text, other web sites, and interactive filters can also be added. Dashboards can be exported as a Chained Report from the Dashboard Designer.
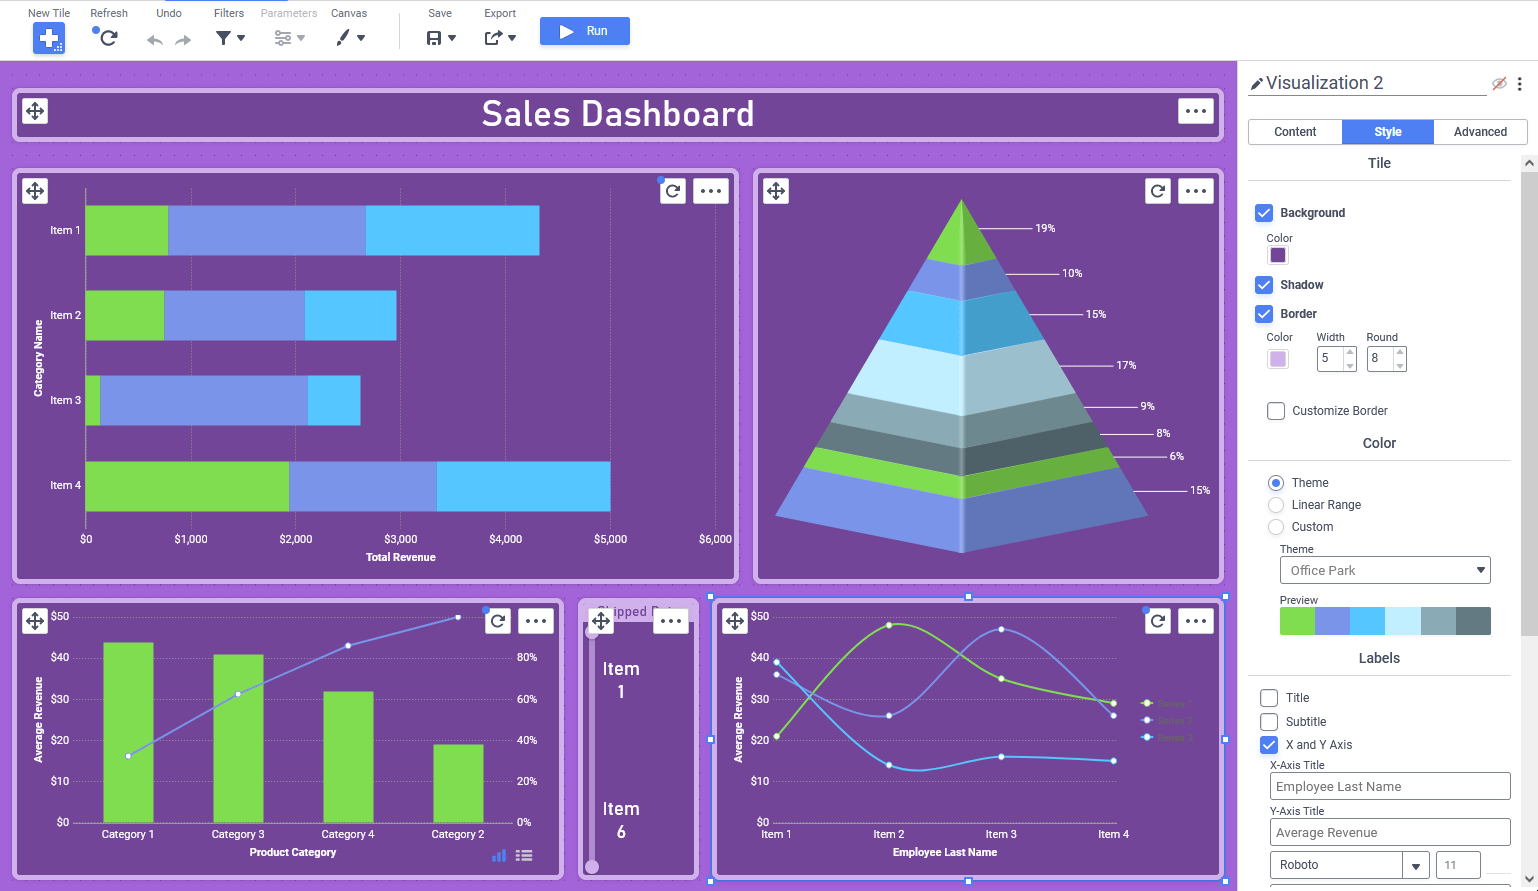
The Dashboard Designer
The Dashboard Designer is comprised of three sections: the Toolbar, the Canvas and the Tile Properties Pane.
Each element on a Dashboard is a contained within a rectangular tile that can be resized and dragged to the desired location. Tiles are arranged onto a grid, and can snap into place next to each other.
Keyboard Shortcuts
There are several useful keyboard shortcuts available in the Dashboard Designer. They are listed in the Keyboard Shortcuts article.
Toolbar
The top of the Dashboard Designer contains a Toolbar for creating and interacting with the canvas and the tiles.

The Dashboard Designer toolbar v2020.1+
In v2019.2:

The Dashboard Designer toolbar v2019.2–v2020.1
 New Tile: creates a new content tile on the canvas
- Refresh: refreshes the data in all tiles on the canvas from the data sources. The Refresh Reminder icon indicates that one or more report or visualization tiles on the canvas may not have the most up to date information
- Undo: undo the previous actions. Supports up to the last 100 actions, starting from the last action taken.
- Redo: redo the previous actions. Supports up to the last 100 undone actions.
- Filters: allows filters to be added to the Dashboard and shows prompting filters imported from the Dashboard’s component reports. Full details on how this menu works can be found in the Dashboard Designer: Filters article
- Parameters: if report tiles on the Dashboard contain Parameters, this menu will be enabled and allow the parameters to be changed. More information can be found in the Dashboard Designer: Parameters article
- Canvas Format: controls how the tiles fit onto the canvas, PDF snapshot exports are formatted and sets default styling options
- Save: saves the Dashboard
- Save Dropdown: changes the name and description text of the Dashboard when saving
- Export: exports the contents of existing reports and visualizations on the Dashboard as a Chained Report or a PDF Snapshot.
- Run: launches the Dashboard Viewer and optionally saves the Dashboard (depending on system configuration)
 New Tile: creates a new content tile on the canvas
 Undo: undo the previous actions. Supports up to the last 100 actions, starting from the last action taken.
 Redo: redo the previous actions. Supports up to the last 100 undone actions.

 Save: saves the Dashboard
 Run: launches the Dashboard Viewer and optionally saves the Dashboard (depending on system configuration)
Canvas
Every element on a Dashboard is a contained on the canvas within a rectangular tile that can be dragged to the desired location, resized and styled. Tiles are arranged onto a grid, and can snap into place next to each other.
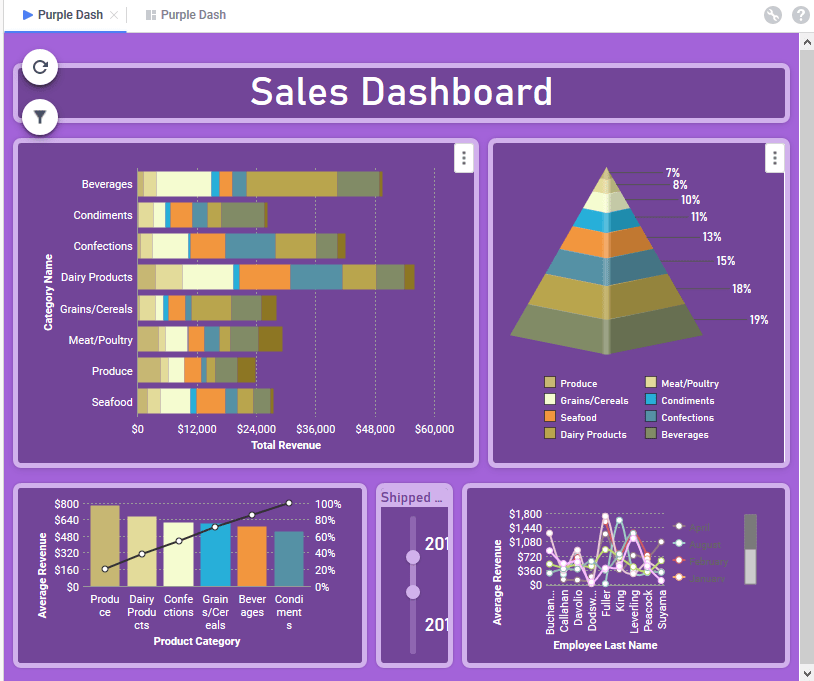
The Dashboard Designer Canvas
Tiles
Each element on a Dashboard is a contained within a rectangular tile that can be resized and dragged to the desired location. Tiles are arranged onto a grid, and can snap into place next to each other.
Tiles contain four elements:
- Move handle — click and drag the move handle to move the tile around on the canvas. Hold the Shift key while dragging the move handle to stretch the tile to fit the available space
- Refresh Icon/Reminder and Tile Menu — contains additional options for tiles. Refer to the Managing Tiles section of this article for more information.
- Tile Header — an optional header with title
- Content — the content of the tile is displayed in this area
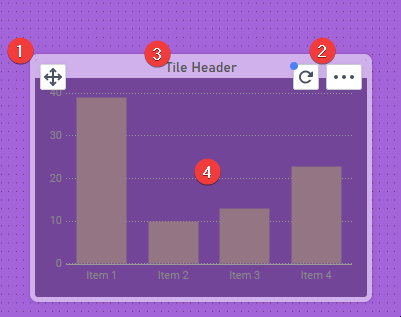
Anatomy of a tile in the Dashboard Designer
Adding Tiles
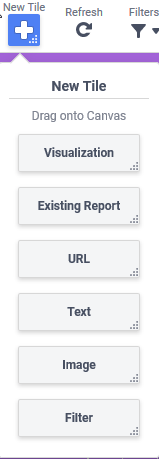
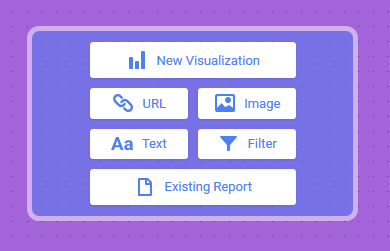
Several different types of tiles can be added to the canvas:
New tiles can be added to the canvas either one of two ways:
Tiles can be dragged to an empty location to fill the space, to the side of an empty location to take up a portion of the space, or over another tile to place it adjacent and resize the other tile to fit. Tiles can then be resized by dragging the handles to alter the tile size.
Dragging a new tile over an existing tile on the left
Screen Fit and Scaling
Dashboards can scale to fit different screen sizes. Click the Canvas Format 
 icon on the Toolbar to open the Canvas Format menu.
In v2021.2, the following Size options are available:
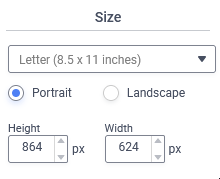
To set the size of the Dashboard canvas, choose a common US or ISO page size from the dropdown, or choose Custom to enter a specific Height and Width.
Choose either Portrait or Landscape to orient the selected page size on the canvas. These dimensions and orientation are also used when exporting the Dashboard as a PDF Snapshot.
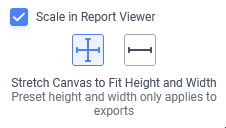
The Scale in Dashboard Viewer checkbox sets how the Dashboard will fit the tiles to the canvas.
Caution
Changing the Scale in Dashboard Viewer mode or choosing a different Stretch Canvas option will automatically rearrange the position and size of the tiles on the canvas.
- When checked (default), the tiles resize to fit the height and width of the canvas in the Dashboard Designer and Dashboard Viewer. The canvas size is limited only by the window or screen on which it appears. When checked, the Stretch Canvas options appear:
- Stretch Canvas to Fit Height and Width — the canvas stretches to fill the window both horizontally and vertically. This mode is similar to the Scale to Screen option in v2019.2–v2021.1. The values in the Height and Width inputs apply to the size of an export as a PDF Snapshot.
- Stretch Canvas to Fit Width — the canvas stretches horizontally to fit the window, but the width of the canvas is fixed. This mode is similar to the Specify Height option in v2019.2–v2021.1. The value in the Width input applies to the size of an export as a PDF Snapshot and the size of the canvas.
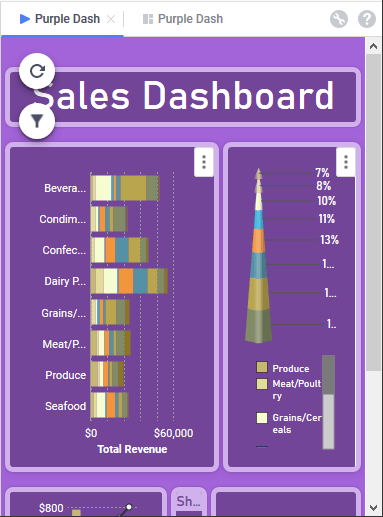
- Check the Automatically Reposition Tiles checkbox to make the tiles reposition each time the width of the canvas is changed. Leave unchecked if the tiles should maintain position when the canvas width is changed. See the examples below, which shows the same Dashboard with a set height and differing widths with the Automatically Reposition Tiles checkbox checked and unchecked:
Automatically Reposition Tiles Checked
Automatically Reposition Tiles Unchecked
- Check the Automatically Reposition Tiles checkbox to make the tiles reposition each time the width of the canvas is changed. Leave unchecked if the tiles should maintain position when the canvas width is changed. See the examples below, which shows the same Dashboard with a set height and differing widths with the Automatically Reposition Tiles checkbox checked and unchecked:
- When unchecked, the canvas will be limited to the Height and Width for both the Dashboard Viewer and in PDF Snapshot exports, and the Stretch Canvas options are not available. This mode is similar to the Specify Height and Width option in v2019.2–v2021.1
- Check the Snap tiles to grid checkbox if tiles should snap to the grid. Leave unchecked to allow free movement of the tile borders
 Stretch Canvas to Fit Height and Width — the canvas stretches to fill the window both horizontally and vertically. This mode is similar to the Scale to Screen option in v2019.2–v2021.1. The values in the Height and Width inputs apply to the size of an export as a PDF Snapshot.
 Stretch Canvas to Fit Width — the canvas stretches horizontally to fit the window, but the width of the canvas is fixed. This mode is similar to the Specify Height option in v2019.2–v2021.1. The value in the Width input applies to the size of an export as a PDF Snapshot and the size of the canvas.
- Scale to Screen causes tiles to resize to fit the height and width of the displayed canvas.
Tiles must be larger than 3-grid units tall and/or 4-grid units wide or less to automatically resize. - Specify Height specifies a static height for the canvas. Enter the desired Height of the Dashboard into the textbox. Tiles must be larger than 20 pixels tall or 4-grid units wide to automatically resize.
- Check the Automatically Reposition Tiles checkbox to make the tiles reposition each time the width of the canvas is changed. Leave unchecked if the tiles should maintain position when the canvas width is changed. See the examples below, which shows the same Dashboard with a set height and differing widths with the Automatically Reposition Tiles checkbox checked and unchecked:
Automatically Reposition Tiles Checked
Automatically Reposition Tiles Unchecked
- Check the Automatically Reposition Tiles checkbox to make the tiles reposition each time the width of the canvas is changed. Leave unchecked if the tiles should maintain position when the canvas width is changed. See the examples below, which shows the same Dashboard with a set height and differing widths with the Automatically Reposition Tiles checkbox checked and unchecked:
- Specify Height and Width prevents tiles from automatically resizing, and the canvas will have a static height and width. Enter the desired Height and Width into the corresponding textboxes.
- Check the Snap Tiles to Grid checkbox if tiles should snap to the grid. Leave unchecked to allow free movement of the tile borders.
Backgrounds and Borders
Default options for the canvas background color, tile and tile header background colors, and tile border colors and widths can also be customized from the Canvas Format menu under Style. These settings can be overridden for individual tiles through the respective tile’s Tile Properties Pane.
- Canvas Color sets the background color of the entire canvas
The following Tile Defaults are applied whenever a new tile is added to the canvas.
- Check the Background checkbox to set colors for the tile and the tile header
- Tile sets the default tile background color
- Heading sets the default tile header background color
- Check the Shadow checkbox to enable a subtle shadow effect to be applied to the tiles
- Check the Border checkbox to set defaults for the tile borders. By default, the settings are applied to all four of the tile borders. To set individual color, width and roundness settings to each border check the Customize Border checkbox.
- Click the color selector icon to choose a border color
- Enter a width in pixels for the border
- Choose a round value to set the roundness of the corners
Managing Tiles
Tiles have a menu with some additional options.
Refresh Icon/Reminder v2021.1+
For existing report and visualization tiles, clicking the Refresh  icon will reload the contents of the tile from the data source.
Depending on system configuration, the Refresh Reminder appears when content in the tile is not the most current information. This can happen when:
- first opening the Dashboard Designer
- adding an existing report tile to the Dashboard
- changing the content of an existing report tile to a different report
- changing the data fields or field formulas of the groups or values of a visualization tile
- changing the aggregate type in a visualization tile
- changing a visualization type to or from Tabular
- adding, removing, or changing the filter field, formula, operator, or value of an interactive filter
- changing the Input Type of an interactive filter on the Canvas
- changing the value of a parameter on the Parameters menu
The Refresh Reminder feature is enabled by default, but can be disabled by the system administrator.
Tile Menu
Click a tile on the canvas to select it, then click the Tile Menu icon to access some additional options. Not all tile types have the same options available. For example, interactive filter tiles do not have expand tile or refresh report options.
- Delete Tile will remove the tile from canvas.
- Duplicate Tile will create a duplicate of the tile on the canvas.
- Dock Filter to Toolbar will relocate an interactive filter from the canvas to the Filters menu. When the Dashboard is run, the filter appears in a Filters pane instead of on the canvas. Applies to interactive filter tiles only.
- Expand Tile will fill the entire canvas with this tile. Once expanded, this option becomes Collapse Tile and will restore the tile back to its original size and location
- Refresh Report will refresh the data in report and visualization tiles
- Open in Designer will load an existing report tile into its respective designer for editing
- Save as Advanced Report will save tiles containing visualizations built directly on the canvas as an Advanced Report and then launch the Advanced Report Designer
- Edit will allow settings to be changed for visualization tiles. Different visualization types will have different options available:
- Type: changes the visualization type displayed in the tile. Click on the different categories (pie, line, column, bar, tabular) to choose one of the available types. See the Dashboard Designer: Visualizations article for more information. Enable or disable a three-dimensional effect on the visualization with the Use 3D Style checkbox.
- Theme: changes a visualization’s visual color theme
- Legend Location: changes the location of a visualization’s legend location from none, right or bottom. Applies only to those bar, column, pie, line and scatter visualizations
- Sort By: change how the visualization is sorted
- Report Order presents the data in the order in which the data source sends it to the application
- Data Labels sorts the data based on the labels in the visualization
- Ascending sorting order is from lowest to highest or from A to Z
- Descending sorting order is from highest to lowest or from Z to A
- Invert Data: for multiple category visualizations (e.g. stack column and stack bar charts), swaps the order of the categories
Tile Properties Pane
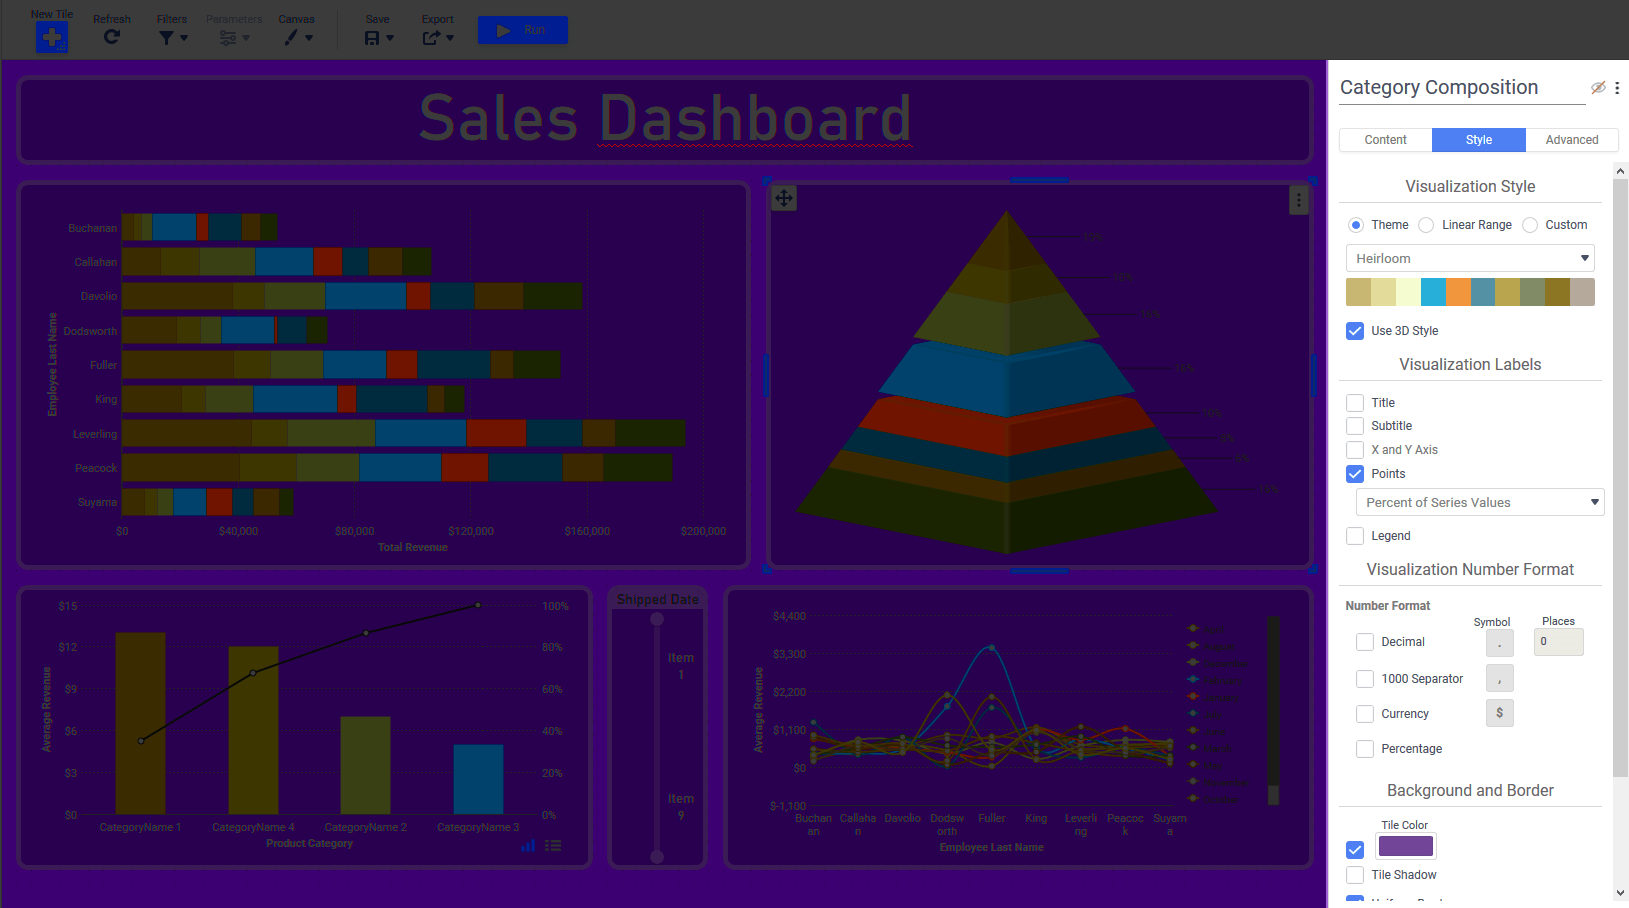
The Tile Properties Pane in the Dashboard Designer
The Tile Properties Pane on the right side of the Dashboard Designer is where the look, feel and behavior of individual tiles on the canvas can be changed. It contains three tabs: Content, Style and Advanced.
The very top of the Tile Properties Pane contains the Tile Header section, including a text entry field for providing a title that can optionally displayed on the canvas. Clicking on the Show Header  icon next to the text entry field will show the header in the tile on the canvas. Clicking Hide Header
  icon will hide it. Clicking on the Title Header Format
  icon will show formatting settings for the tile header allowing the font type, size, alignment and styling to be applied. Clicking the Title Header Format icon again will hide these settings.
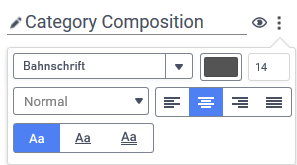
Tile Header portion of the Tile Properties Pane, with formatting settings shown
Depending on the type of tile selected on the canvas, the availability of the tabs in the Tile Properties Pane will change. Tabs which are not available for a particular tile type will be grayed out. Each tile type has its own article with details of the respective tile properties. A list of tile types with links to more information is at the beginning of this article.
