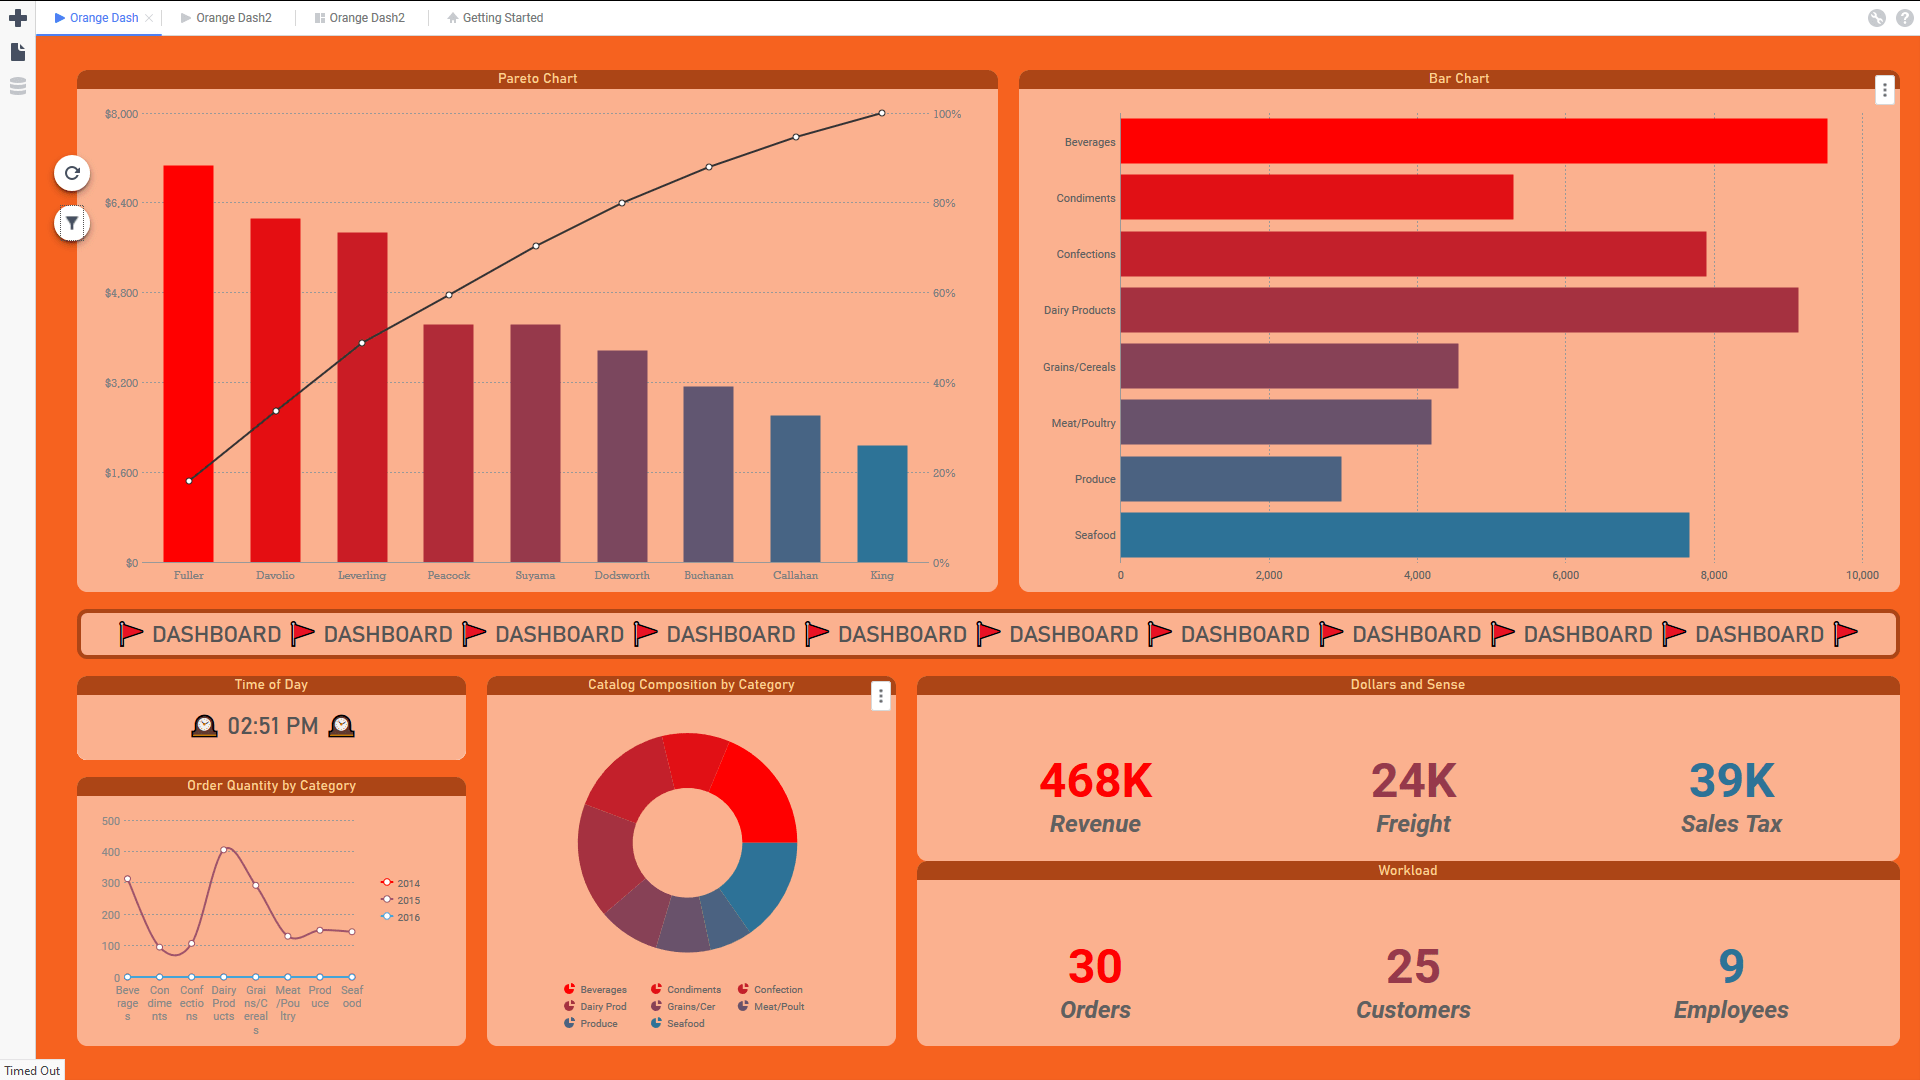
Dashboard Viewer (v2019.2+)
When a Dashboard is run, it is displayed in a new tab called the Dashboard Viewer. Reports, Visualizations and other Dashboard content appear in rectangular Tiles on the Canvas. Reports, Visualizations and Filter tiles are interactive, as are any embedded web pages. The tiles can be set to refresh periodically, or can be refreshed manually. Filters placed on the canvas or in the Filters Pane can filter the displayed data. Reports containing Parameters can have them adjusted in the Parameters pane. Basic Dashboard viewing is also possible on mobile devices, although the best experience will be with Dashboards specifically formatted for small mobile screens.
Running a Dashboard in the Dashboard Viewer
Run a Dashboard
- From the Dashboard Designer, click the
 Run button on the top toolbar. Depending on system configuration, this will also save the Dashboard.
 - From the Report Tree, select the Dashboard in the tree, then click the Run icon, or click the Menu icon and click Run Report.
 Run button on the top toolbar. Depending on system configuration, this will also save the Dashboard.
 Report Tree, select the Dashboard in the tree, then click the Run
  icon, or click the Menu
  icon and click
 The Dashboard Viewer opens in a new tab, indicated by the Viewer  icon. If a Dashboard refreshes automatically but is not currently the selected tab, the Dashboard’s name will flash. If the Dashboard is edited in the Designer it will need to be run again to see the changes in the Viewer, which will launch in another new tab.
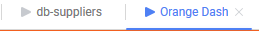
Two Dashboard Viewer tabs, “Orange Dash” is the selected tab
If any of the reports on the Dashboard contain filters or parameters which have their Prompt for value setting enabled, a prompt will appear before the Dashboard loads.
Keyboard Shortcuts
There are several useful keyboard shortcuts available in the Dashboard Viewer. They are listed in the Keyboard Shortcuts article.
Interacting with Dashboards
There are a number of ways to interact with tiles on the canvas. The available options depend on how the Dashboard was designed and the type of content on it.
Every Dashboard Viewer will have a floating Refresh  icon in the top-left corner of the canvas. Clicking on this icon at any time will refresh the data in the tiles.
If the Dashboard also includes interactive filters, a floating Filter  icon will appear below the Refresh icon. Clicking on the Filter icon or pressing the F key on the keyboard will open the Filters Pane on the right side of the screen where filters can be viewed. Filters narrow down the data presented in a tile. More information is included in the Filters section below. Clicking the icon or pressing F again will hide the pane.
If any of the reports on the canvas include system or report level Parameters, a floating Parameters  icon will appear along with the Refresh icon. Clicking on the icon or pressing the P key on the keyboard will open the Parameters Pane on the right side of the screen where these parameters can be changed. Clicking the icon or pressing P again will hide the pane.
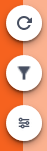
This Dashboard has both Interactive Filters and Parameters on it
The floating icons may be relocated anywhere along the left edge of the canvas by clicking and dragging any of the icons along the edge. The icons disappear if the mouse is not moved over the canvas for a few seconds, and will reappear on the next mouse movement.
Reports and Visualizations
Report tiles are reports already created in the application and then loaded into a tile on the canvas. A Visualization tile is a graphical representation of data that can be designed directly on the canvas without first creating a report. Both report and visualization tiles can display tabular or graphical data.
Hover the mouse over a tile to show a navigation bar at the bottom of the tile. Depending on the particular tile’s content and its Advanced Properties, some options may not be available:
- Page through the report by using the navigation icons . The Page Up and Page Down icons move one page at a time, and the Page Home and Page End icons will move to the first and last page of the report, respectively.
- Enter text into the Find field, then click the up or down icons to search for text in the report
- Click the Show Chart and Show Table icons to swap between chart or tabular view


 . The Page Up
  or down
  icons to search for text in the report
 and Show Table
  icons to swap between chart or tabular view
Click the Tile Menu ![]() icon to access some additional options for interacting with tiles:
icon to access some additional options for interacting with tiles:
- Expand Tile will cause the tile to fill the entire canvas
- Collapse Tile will return the tile to its original size
- Refresh Report will refresh the data in the tile
- Save as Advanced Report will save the tile as an Advanced Report. The corresponding Report Designer will be launched.
- Export will export the tile’s content in one of the available export file formats. Depending on the system configuration and the report’s settings, choose from Excel, RTF, PDF, or CSV.
Filters
Use Filters to narrow down the data for multiple reports at once.
Interactive Filter tiles can appear as scales, menus, or checkboxes on the Dashboard. Hover the mouse over the filter tile to see which tiles on the canvas are affected by this filter. Affected tiles will be highlighted with a blue outline.
Select one or more data values, or a range of data, to apply the filter to all its affected tiles. This will automatically refresh the reports.
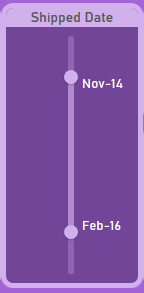
A vertical scale Interactive Filter tile which selects a range of shipping dates
Clicking on the floating Filter icon will open the Filters Pane on the right side of the screen where filters can be viewed and modified. Filters in the pane are called Docked Filters. An example is provided below.
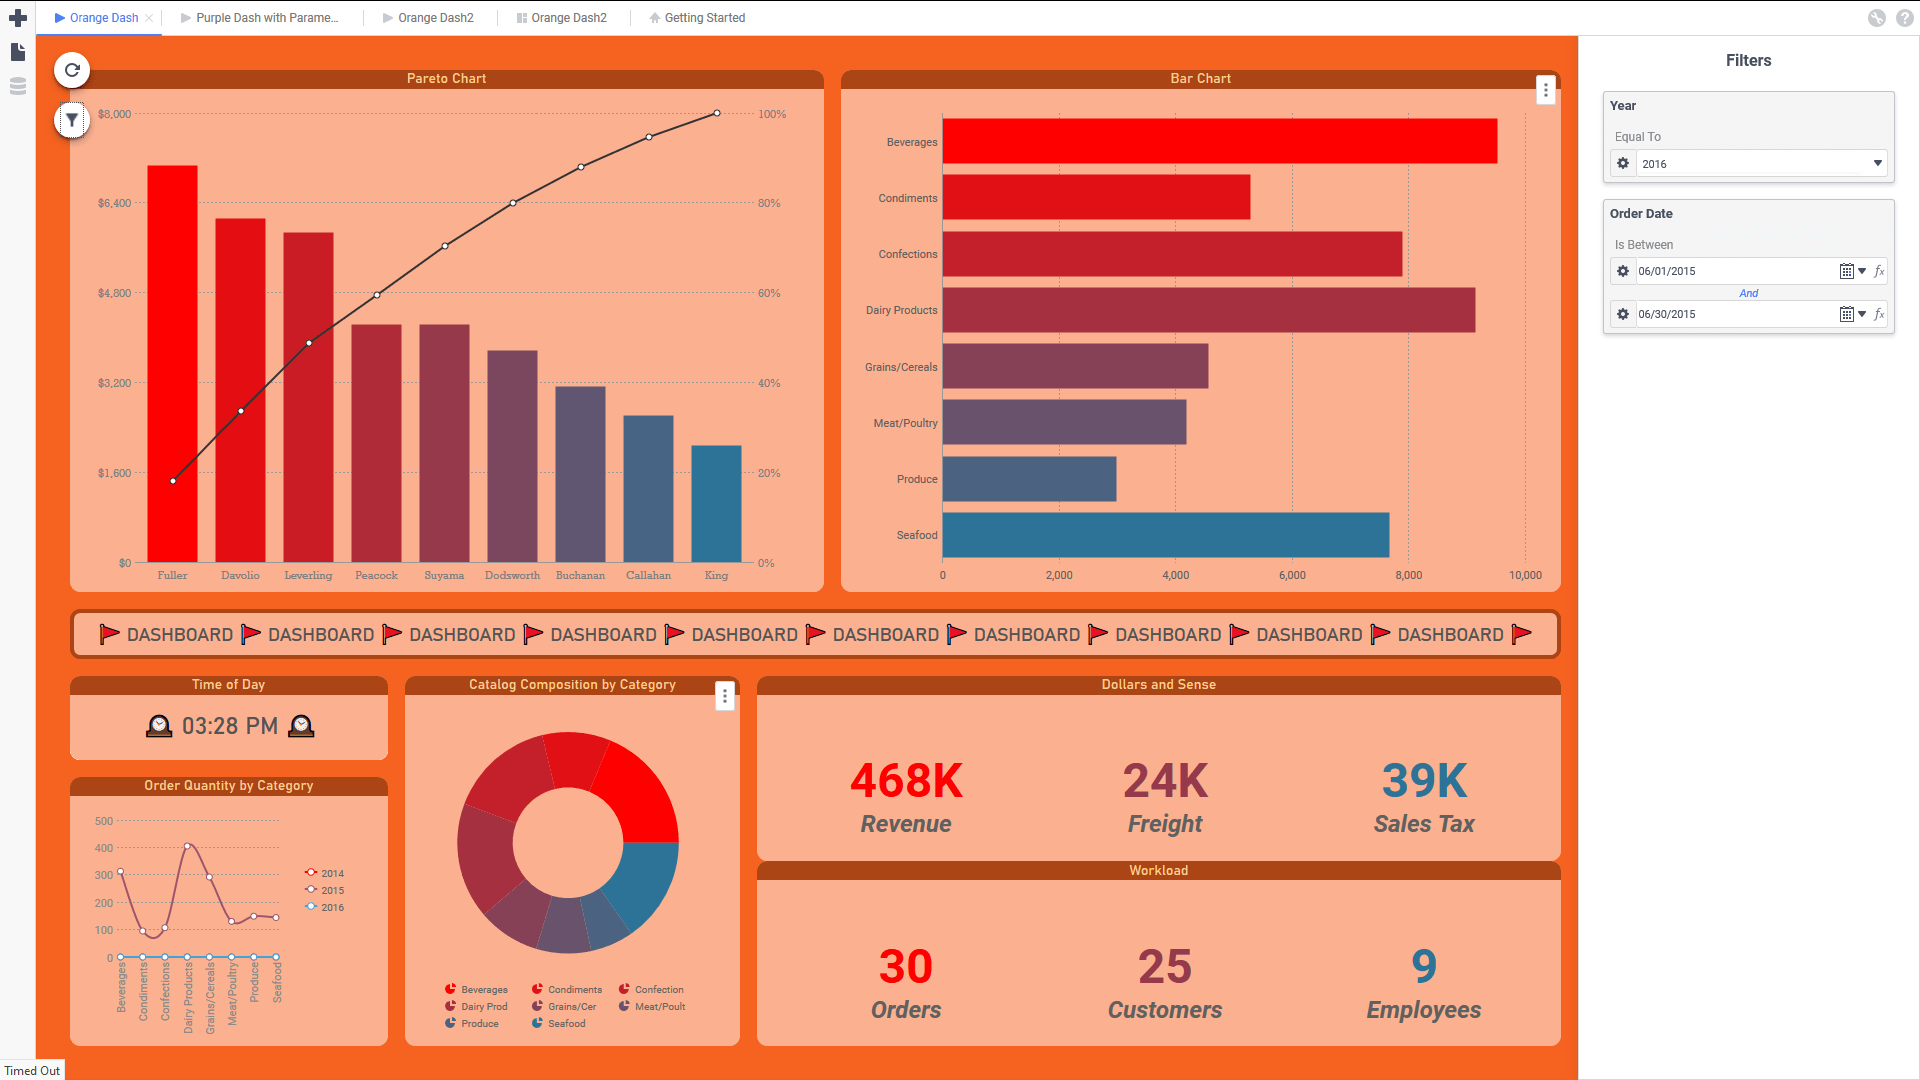
Dashboard Viewer with the Filters pane open on right side of screen
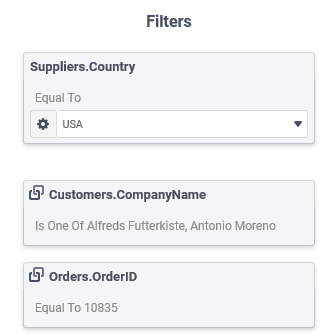
The sample Filters Pane on the left is for a Dashboard with three docked filters.
Hovering the mouse over the filter item in the pane will highlight the affected tiles with a blue dashed outline.
- The first filter is an interactive filter on the data object
Suppliers.Country. The operator Equal To means that only data where theSuppliers.Countryis equal to the value USA will be included. The Country value can be modified by using the dropdown to change it. Clicking on the Settings icon changes how the operator compares the value with the filter field (choose from Starts With or Contains). - The second two filters on
Customers.CompanyNameandOrders.OrderIDare linked from a parent report which has linked (or drilled-down) to this Dashboard. This linking behavior is indicated by the Linked Report icon. Both the linking filter and any other filters on the parent report will be imported to the Dashboard. Linked filters cannot be changed in the Dashboard Viewer. Hover over the Linked Report icon to see the folder and name of the parent report.
 icon changes how the operator compares the value with the filter field (choose from Starts With or Contains).
 icon. Both the linking filter and any other filters on the parent report will be imported to the Dashboard. Linked filters cannot be changed in the Dashboard Viewer. Hover over the Linked Report
 For more information about how Filters interact with reports, review the article on Filters.
Parameters
Parameters are system-wide or report-level variables that can be included in reports. There are several built-in parameters, and the system administrator can configure additional ones. Consult with them to find out what parameters are available. Individual reports can have their own parameters. The article on Report Level Parameters explains how to setup and use parameters in more detail.
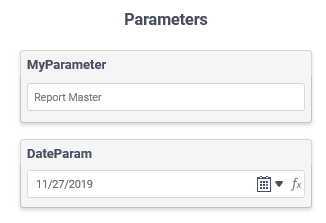
The sample Parameters Pane to the left is for a Dashboard with reports that contain two parameters, the first named MyParameter and the second named DateParam whose values are Report Master and 11/27/2019 respectively.
Both parameters can be modified by editing their respective values using the controls available in each parameter item.
