Advanced Reports: CrossTabs
Use a CrossTab, or cross tabulation, for grouping and summarizing data fields that expands vertically and horizontally depending on the number of data groupings. CrossTabs are also known as two-way tables, contingency tables, or pivot tables.
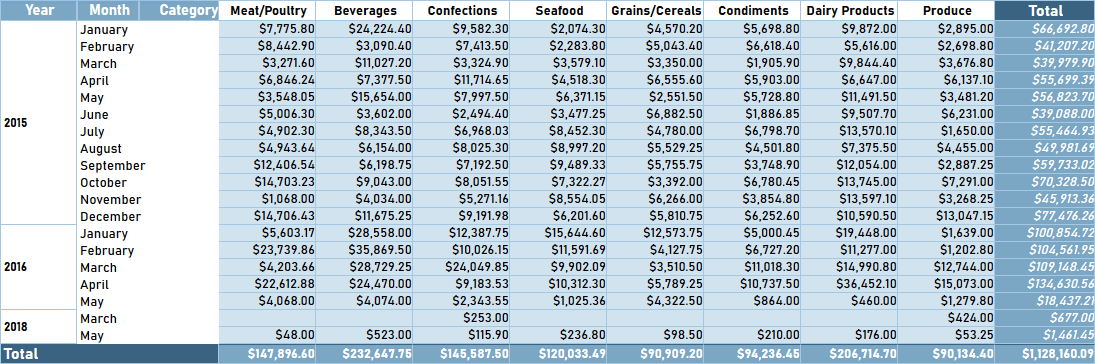
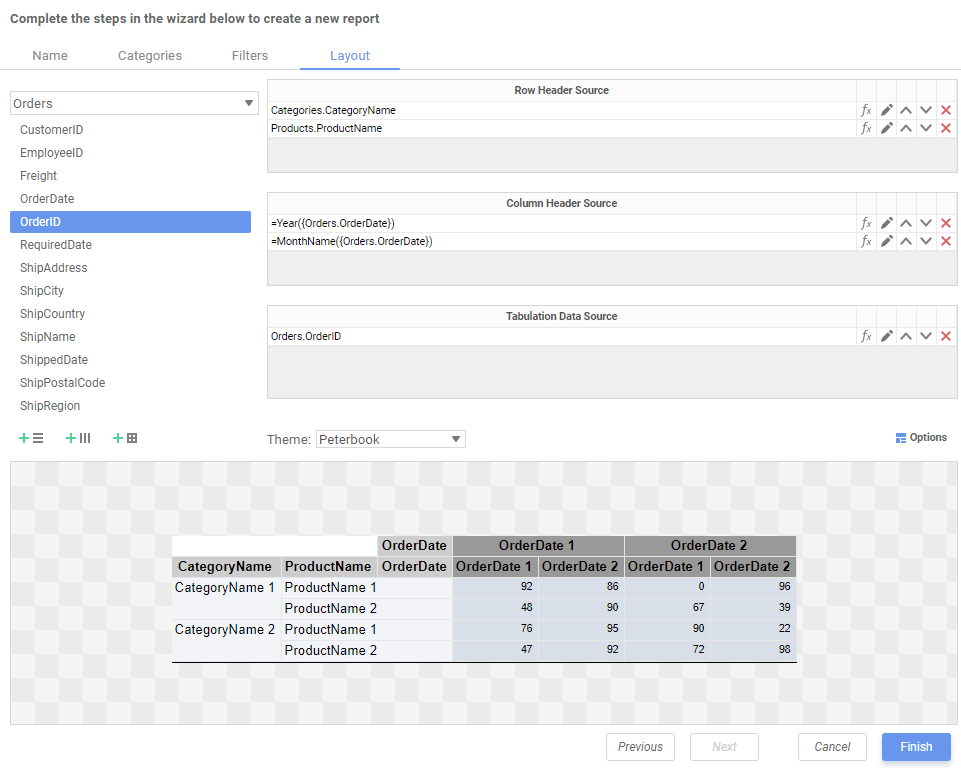
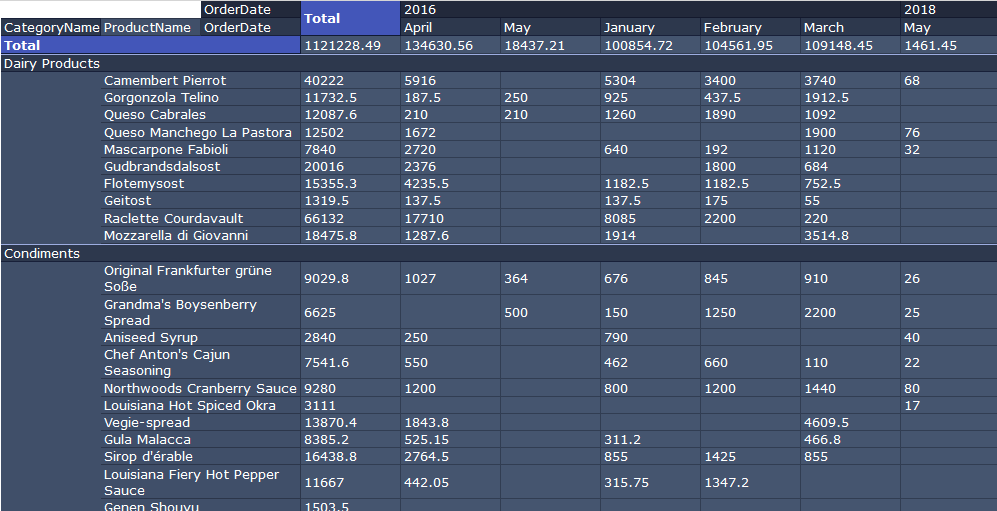
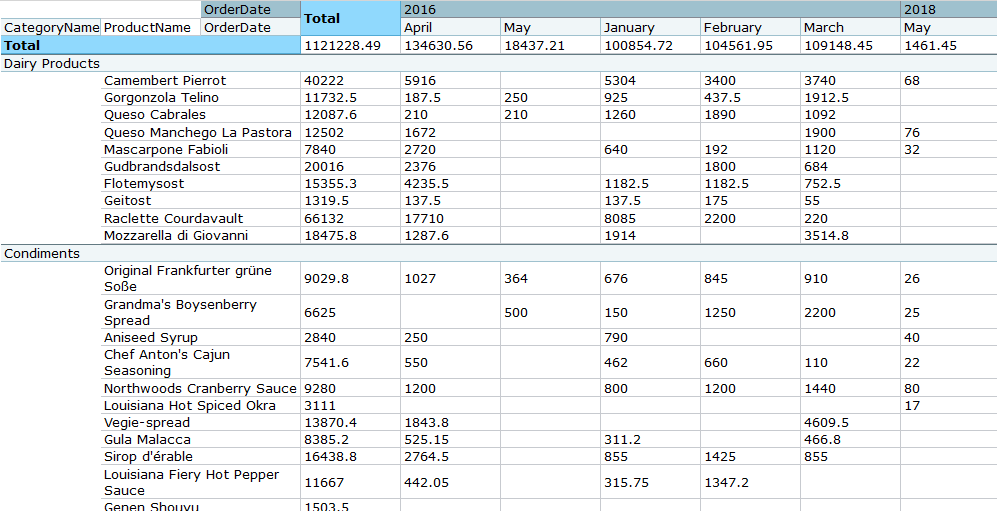
A CrossTab report built with the CrossTab Report Wizard
Create a CrossTab
CrossTab Reports can be added to an existing report from the Report Designer, or they may be created as a new report from the main menu.
From the Report Designer Toolbar
To add a CrossTab to a report in the Report Designer:
- Select a Group Footer (including Footers in a Repeating Group) or Report Footer cell.
- Open the CrossTab Data Designer dialog:
- (pre-v2021.1) Click the CrossTab
 icon in the toolbar.
 - (v2021.1+) Click the Insert icon on the toolbar, then click CrossTab. The dialog resembles the Layout tab described below.
- (pre-v2021.1) Click the CrossTab
 icon in the toolbar.
 icon on the toolbar, then click
  CrossTab. The dialog resembles the
 From the Main Menu CrossTab Report Wizard
CrossTabs are created from the Main Menu just as any other report is. Creating a CrossTab from the Main Menu will launch the CrossTab Report Wizard.
The CrossTab Report Wizard is an interactive tool which will walk through the process of creating a new Advanced Report with a CrossTab embedded within it. All of the settings in the wizard can be modified in the Report Designer after the report is created.
The CrossTab Report Wizard has four tabs: Name, Categories, Filters, and Layout. All tabs except Layout are required to create the new report.
Name
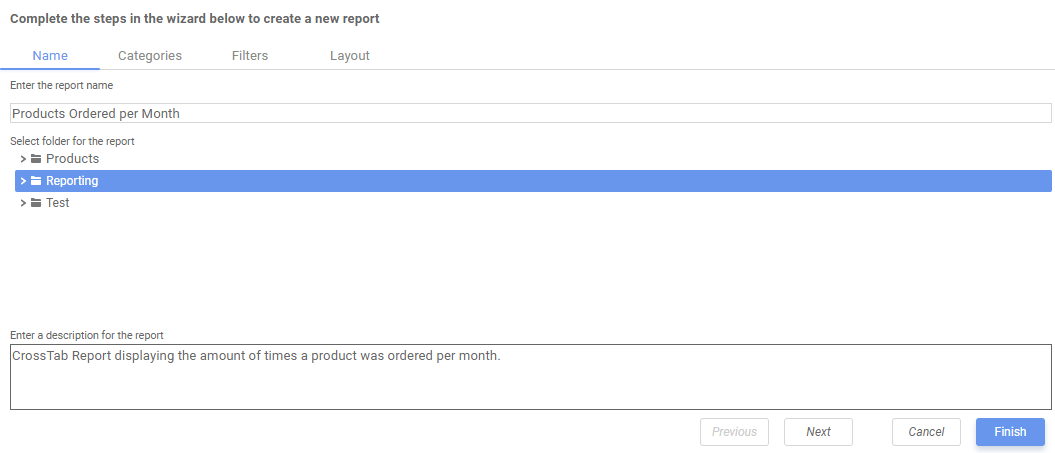
In the Name section, enter a name for the report and select a Folder where it will be saved.
The report name can be up to 255 characters long, but cannot contain the following special characters
? : / * " < >
Enter an optional description for the report in the textbox.
Categories
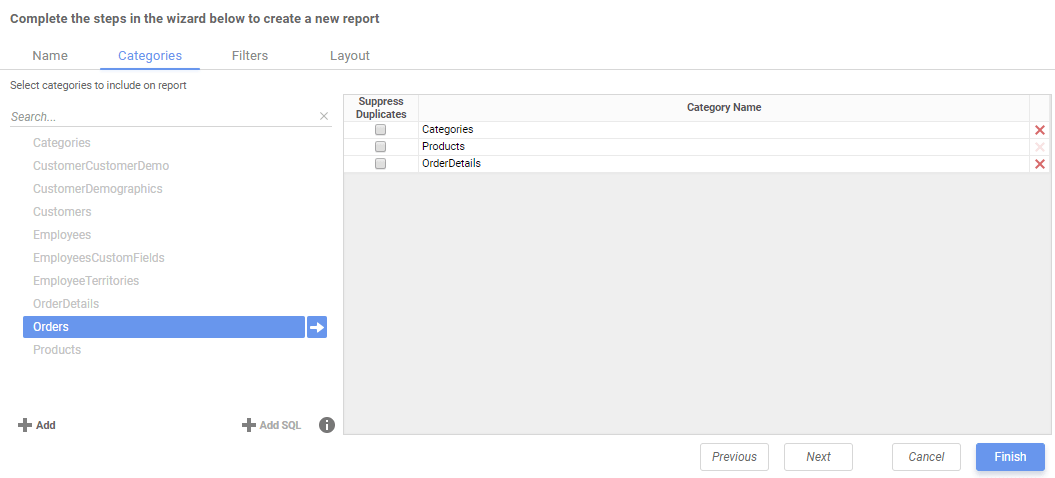
In the Categories section, select the Data Objects to include in the CrossTab. It is important to understand the difference between Data Categories and Data Fields. Data objects are arranged into folders. Those objects are further expanded into fields. A field is a parcel of data from a data object, such as the name of a Product or an Employee ID number.
- To add a Data Object, either drag and drop it to the Data Object Name Column, click the Add button, or double-click the field name
- To search for a specific Data Object or folder, type its name into the Search field.
- To see what fields are in a Data Object, click the View Data Object Fields icon.
- Check the Hide Repeated Values checkbox to stop duplicate information from appearing on the report.
- Each data object must be referenced by a unique Alias. The alias can also be used to provide a different name for the data object. This column will only appear if enabled by the system administrator. See Advanced Reports: Data Objects for more information.
- To remove a Data Object, click the Delete icon at the end of the row.
 icon.
icon. icon at the end of the row.
Filters
In the Filters tab, create statements to filter the data at runtime.
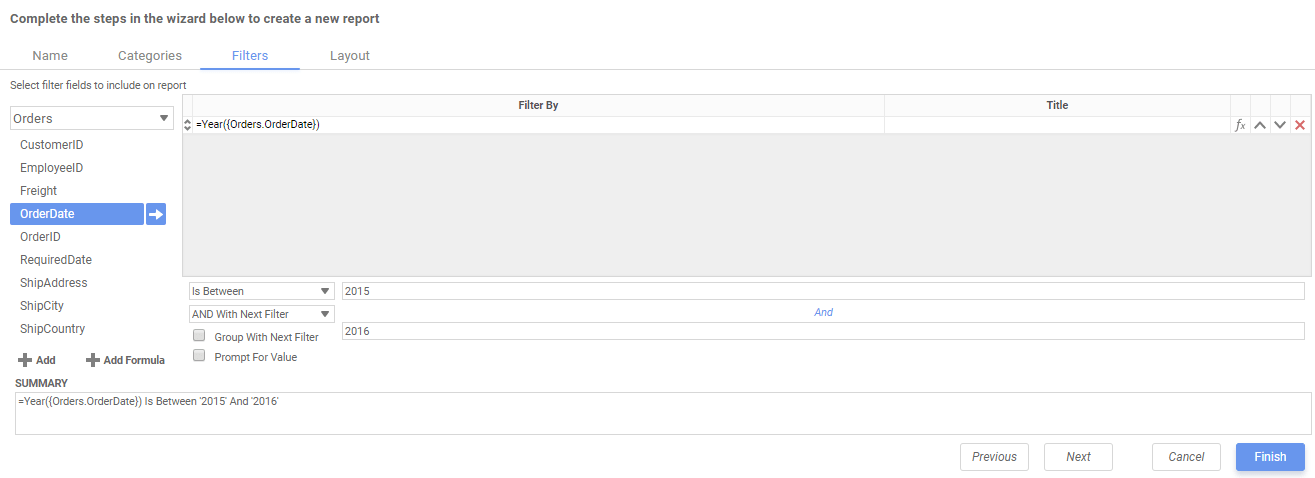
A date filter applied to output data from the years 2015 to 2016
There is no limit to the number of filters that can be defined. Filters can be numeric (up to eight decimals) or alphanumeric.
-
- To filter a Data Field, either drag and drop it to the Filter By column, click the Add button, or double-click on its name.
- To filter using a custom or built-in formula, click the Add Formula button.
More information about how to use this feature is contained in the Filter by Formula article. - Use the Move Item Up and Move item Down icons to move the rows to set the filter priority. The top filter has the highest priority.
- To remove a filter, click the Delete icon at the end of the row.
- To filter a Data Field, either drag and drop it to the Filter By column, click the
 and Move item Down
  icons to move the rows to set the filter priority. The top filter has the highest priority.
Detailed information about creating and editing filters can be found in the Filters article.
Layout
In the Layout tab, design the CrossTab by moving Data Fields into the Row Header, Column Header, and Tabulation Data panels.
Row Headers
Row Headers expand a CrossTab vertically. A CrossTab has a row for each unique value of a Row Header. For example, if you were using sales data, you may have the Row Headers Category.CategoryName and Products.ProductName to provide rows for each product grouped by category.
- To add a Row Header, either drag and drop it to the Row Header Source panel or use the Add Row Header icon
- Click the Formula Editor icon to insert a formula into the Row Header.
- Click the Edit Header icon to open the Header Options menu.
- Set a label for the Row Header. This label will appear at the top of the CrossTab.
- Select a sorting method and direction:
- None: Does not sort the Row Headers.
- Header Value (Text): Sorts the Row Header by its values as though they are text.
- Header Value (Number): Sorts the Row Header by its values as though they were numbers.
- Tabular Totals: Sorts the Row Header by the totals of the Tabulation Data.
- Select where to display subtotals by using the Placement dropdown:
- None: Does not display subtotals.
- Top: Displays subtotals above the Tabulation Data for each Row Header value.
- Bottom: Displays subtotals below the Tabulation Data for each Row Header value.
- Set a label for the subtotals.
- Use the Move Item Up and Move Item Down icons to rearrange the order of the Row Headers.
- To remove a Row Header, click the Delete icon.
 icon
icon icon to insert a formula into the Row Header.
 icon to open the Header Options menu.
Column Headers
Column Headers expand a CrossTab horizontally. A CrossTab has a column for each unique value of a Column Header. For example, if you were using sales data you may have the Column Headers Year({Order.OrderDate}) and MonthName({Orders.OrderDate}) to provide columns for each month grouped by year.
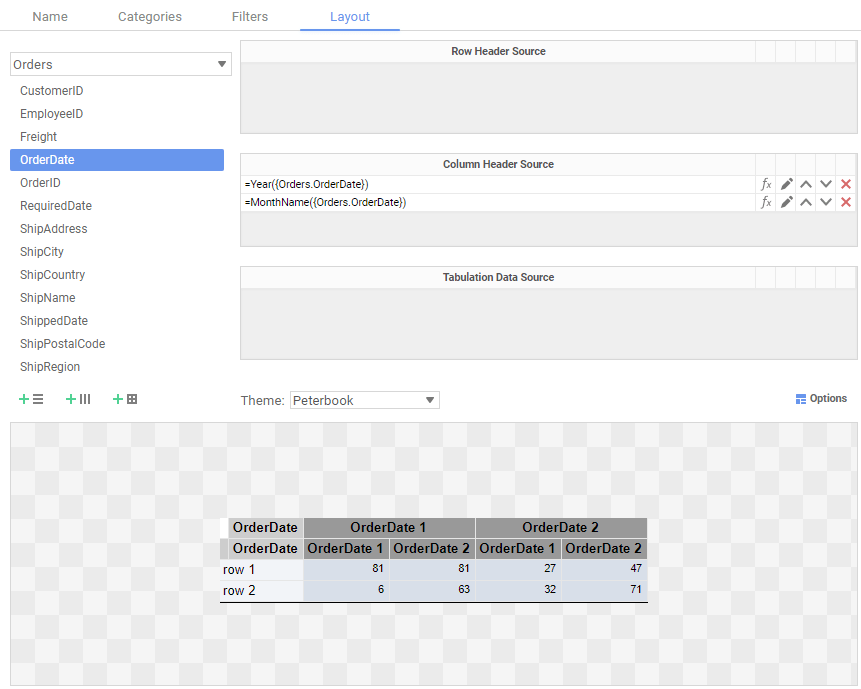
CrossTab Design Wizard with two column headers
- To add a Column Header, either drag and drop a data field to the Column Header Source pane or click the Add Column Header icon.
- Click the Formula Editor icon to insert a formula into the Column Header.
- Click the Edit Header icon to open the Header Options menu.
Column Header Options dialog
- Set a label for the Column Header to appear at the top of the CrossTab.
- Select a sorting method and direction:
- None: Does not sort the Column Headers.
- Header Value (Text): Sorts the Column Header by its values as though they were text.
- Header Value (Number): Sorts the Column Header by its values as though they are numbers.
- Tabular Totals: Sorts the Column Header by the totals of the Tabulation Data.
- Select where to display subtotals by using the Placement dropdown:
- None: Does not display subtotals.
- Left: Displays subtotals to the left of the Tabulation Data for each Column Header value.
- Right: Displays subtotals to the right of the Tabulation Data for each Column Header value.
- Set a label for the subtotals.
- Use the Move Item Up icon and Move Item Down icon to rearrange the order of the Column Headers.
- To remove a Column Header, click the Delete icon at the end of the row.
 icon.
icon.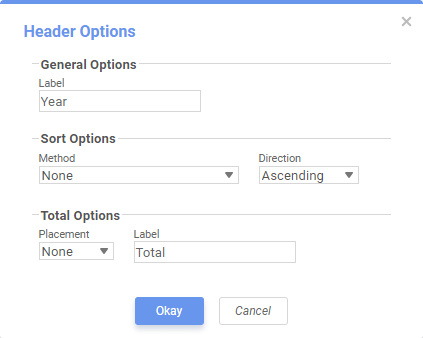
Tabulation Data
Tabulation Data provides information when data exists for both the Column Header and Row Header values. For example, if you have a Row Header on products and a Column Header on the month, then Tabulation Data of Orders.OrderID may use the Count function to display how many orders contained each product each month.
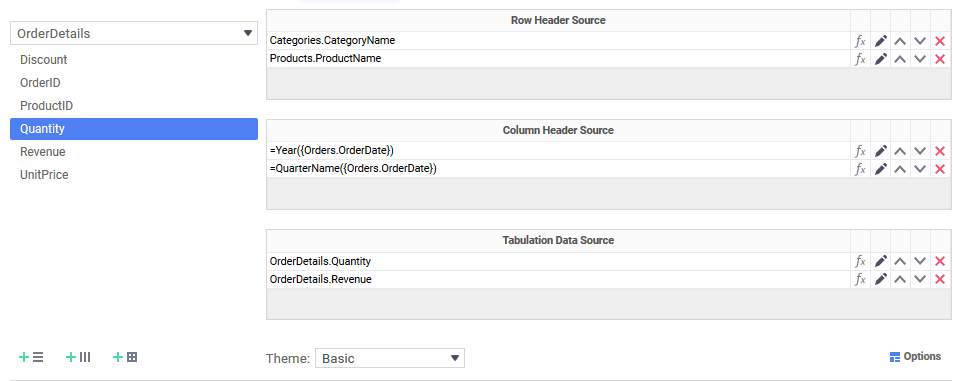
CrossTab Report Design Wizard with row header, column header and tabulation data sources
- To add a Tabulation Data field, either drag and drop it to the Tabulation Data pane or click the Add Tabulation Data icon.
- Click the Formula Editor icon to insert a formula into the Tabulation Data.
- Click the Edit Tabulation Data icon to open the Tabulation Options menu.
- Set a label for the Tabulation Data to appear at the beginning of each row.
- Use the Method dropdown to select the summary function to be applied to the Tabulation Data:
- Sum: Totals the Tabulation Data.
- Count: Counts the Tabulation Data.
- Average: Takes the mean of the Tabulation Data.
- Minimum: Displays the lowest value in the Tabulation Data.
- Maximum: Displays the highest value in the Tabulation Data.
- Use the Value dropdown to select how the Tabulation Data should be displayed:
- None: Displays the value of the Tabulation Data without applying any formula.
- Aggregate: Display the result of the selected method.
- Percent of Row: Display the result of the selected method as a percentage of the row total.
- Percent of Column: Display the result of the selected method as a percentage of the column total.
- Use the Move Item Up and Move Item Down icons to rearrange the order of the Tabulation Data.
- To remove a Tabulation Data source, click the Delete icon .
 icon.
icon.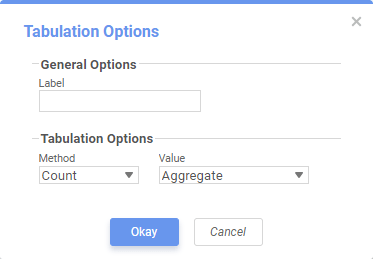
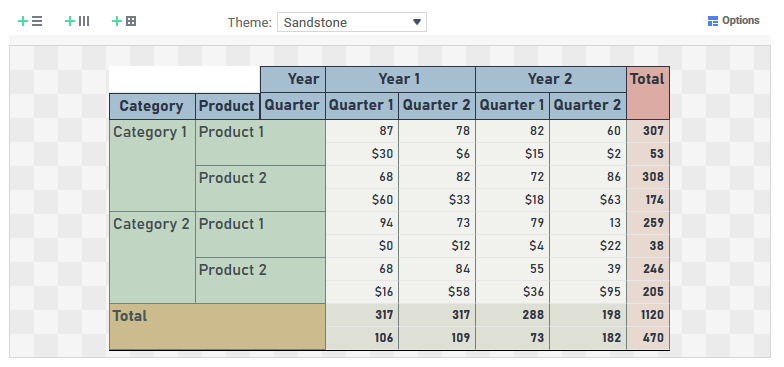
CrossTab Themes
The Theme dropdown can be used to quickly style the CrossTab using a predefined theme.
Further styling can be done in the Report Designer.
CrossTab Options
Settings that affect the entire CrossTab are controlled in the CrossTab Options Menu. Open the CrossTab Options Menu by clicking the ![]() Options button. Using this menu, you can adjust the following settings:
Options button. Using this menu, you can adjust the following settings:
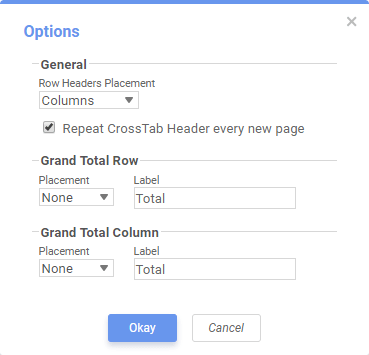
CrossTab Options Menu
General
- Use the Row Headers Placement dropdown to determine how the Row Headers are displayed:
- Columns: Display the Row Headers in columns from left to right in the order they appear in the Row Header Source panel.
- Hierarchical: Display Row Headers in a hierarchical structure using indentation to display their order.
- Check Repeat CrossTab Header every new page to repeat Row Header labels and Column Headers on each new page.
Grand Total Row
To get a total for each column, select Top or Bottom from the Placement dropdown in the Grand Total Row section and provide a label in the Label text box.
Grand Total Column
To get a total for each row, select Top or Bottom from the Placement dropdown in the Grand Total Column section and provide a label in the Label text box.
Preview
A preview layout of the steps applied above
At the bottom of the Layout section, a preview will display how the CrossTab will appear based on the fields that have been added.
Finally, clicking the Finish button will create the report and open the CrossTab Report Designer.
Work with CrossTabs in the Report Designer
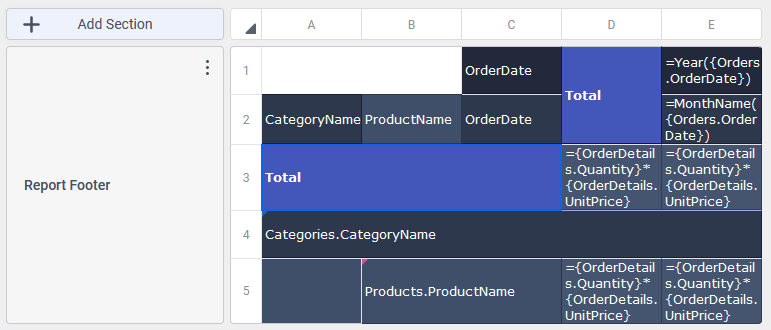
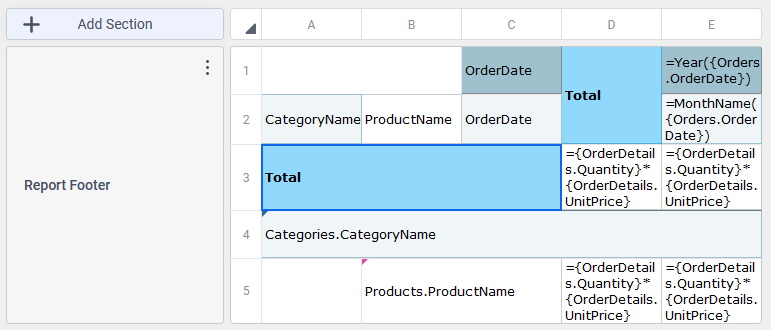
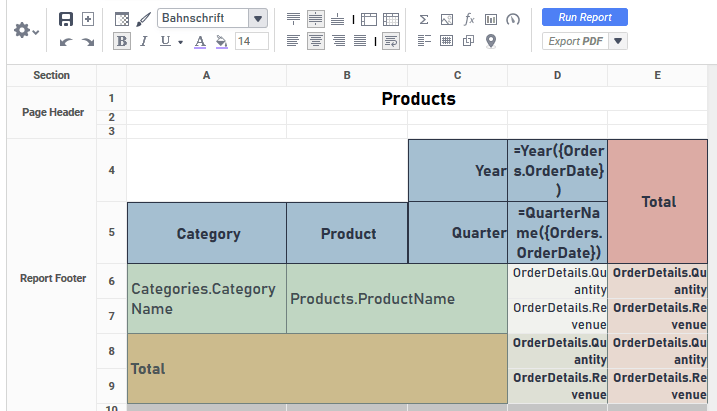
Upon entering the Report Designer, the new CrossTab appears in the Report Footer section:
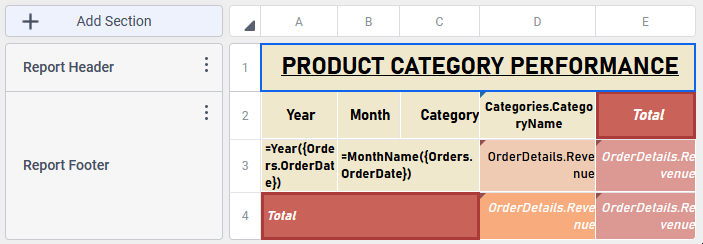
CrossTab Report in Report Designer v2021.1+
CrossTab Report in Report Designer v2019.1
To edit the CrossTab after its creation open the CrossTab Data Designer dialog by either:
- right-clicking on the CrossTab then clicking Edit CrossTab or
- double-click anywhere on the CrossTab
The CrossTab Data Designer dialog resembles the Layout tab of the CrossTab Report Wizard.
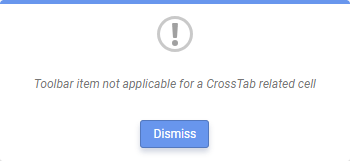
Visualizations and formulas may not be added to the CrossTab. The following error message appears if trying to add one of these to the report:
CrossTab Formatting
CrossTabs often contain a large amount of information and may appear cluttered if they are not well formatted. To help avoid overwhelming appearing reports:
- Set predefined widths of rows containing long strings of characters or integers.
- Use a theme or apply color to cells via cell formatting to help differentiate between certain sections.
- Add borders with cell formatting to detail and header sections.
- Abbreviating longer strings using the built-in String functions. For example,
Left(MonthName({Orders.OrderDate}), 3)will output the first three letters of each month. - In the Report Viewer Options, uncheck Simulate PDF.
- Use filters to limit the size of the data set.
Note
Conditional formatting expressions are not evaluated for empty CrossTab cells.
