Filters
Filters narrow the scope of reports by restricting the data by specified criteria.
For example, imagine a data object containing a row with every sale a company ever made. A filter can limit the report to only sales from the past month. This also has the benefit of speeding up report execution.
There are three types of filters available in the Report Filters dialog:
This article covers Standard Filters, refer to the respective articles for Group Min/Max and Top/Bottom filters.
Standard filters limit data by only showing rows where the values for a field meet a certain condition.
Standard Filters are comprised of three parts: the filter field, the operator and the values. To help design standard filters, consider a phrase that spells out what to include. For example: “Include only the products whose unit price is more than $10” or “Do not include any employee who was hired after 5/1/2008”.
The filter field is the data field that contains the data that will be filtered. In the above examples, the filter field would be the product ID number or employee hire date.
The operator sets the filtering action. The table in Step 3 below lists all of the available filter operators and how they work. In the above examples, the operators would be Greater Than for the products unit price and Less Than for the employee hire date.
The values are the criteria that the filter field must meet when compared by the operator. In the above examples, the values would be $10 and 5/1/2008. Some operators allow there to be more than one value.
Adding Standard Filters
This section applies to Advanced Reports. To learn about adding filters to ExpressView or Dashboards, refer to the ExpressView: Managing Data and Dashboard Designer: Filters articles.
- Click the Filter
 icon to open the Report Filters dialog.
 - Add a data field to filter by, called the Filter Field by first selecting a Data Object from the dropdown, and then either:
- clicking the arrow icon to the right of the data field’s name
- clicking the Add button at the bottom of the data field’s tree
- double-clicking on the field’s name
- drag-and-dropping the data object from the tree to the Filter By panel
- clicking the Add Formula button to add a formula filter to the report. For more information, refer to the Formula Filters section of this article.
- For each data field, select an operator from the Equal To dropdown. When the report is run, the field value for each row is checked against the condition for that field. Only the rows where the field satisfies the condition will be included in the report.The following table describes the filter operators and their applicable data types:
Table A — Filter Operators Operator Type Filter Values Matching Values Not-Matching Values Equal To (=) Any July 4, 2016 July 4, 2016
July 4, 2016 12:00 AMJuly 4
July 4, 2016 2:00 PMNot Equal To (!=) Any July 4, 2015 July 4
July 4, 2016 2:00 PMJuly 4, 2016
July 4, 2016 12:00 AMLess Than (<) Number, Date/Time July 4, 2016 July 3, 2016 July 5, 2016 Less Than or Equal To (<=) Number, Date/Time July 4, 2016 July 3, 2016
July 4, 2016July 5, 2016 Greater Than (>) Number, Date/Time July 4, 2016 July 5, 2016
July 4, 2016 5:00 PMJuly 3, 2016 Greater Than or Equal To (>=) Number, Date/Time July 4, 2016 July 4, 2016
July 5, 2016
July 4, 2016 5:00 PMJuly 3, 2016 Starts With Text, Number 203 2035550224 8458081120 Not Starts With Text, Number 203 8458081120 2035550224 Ends With Text, Number 224 2035550224 7188044606 Does Not End With Text, Number 224 7188044606 2035550224 Contains Text, Number 555 2035550224 2038081120 Does Not Contain Text, Number 555 2038081120 2035550224 Is Between Any 1, 4 1, 1.5, 3, 4 0.999, 5 Is Not Between Any 1, 4 0.999, 5 1, 1.5, 3, 4 Is One Of Any 1, 2, 3, 4 1, 2, 3, 4 1.1, 9 Is Not One Of Any 1, 2, 3, 4 1.1, 9 1, 2, 3, 4 Note
The Is Between operator is inclusive. Values should be in least to greatest order.
- Enter a filter value or values, by either:
- Entering them directly with the keyboard.
- Select them from the list of existing values. Type into the filter field to search for data values to filter. Click the Settingsicon to select whether to search for values that either Start With or Contain the typed text (v2017.3+).
- Click the Filter Function icon to choose a pre-defined value based on a formula programmed by the system administrator. (For example, First Day of Current Month or Friday of Last Week).
- Optional: If there are multiple filters, they may be logically grouped together. See Grouping Filters Together for more information.
- Optional: If the user should be prompted to enter a filter value when the report is run, check the Prompt For Value checkbox. A Title for each filter object may be added. This title will be displayed in the prompt to the user when the report is executed. See Prompting for Values below.
- If necessary, change the order of the filters by either:
- clicking the Move Item Up or Move Item Down icons
- click and drag the Grip icon to move the filter to the desired location
- clicking the Move Item Up
 icon to open the Report Filters dialog.
 Add button at the bottom of the data field’s tree
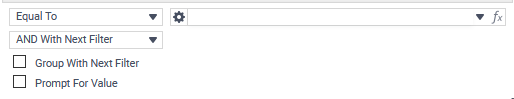
 icon to select whether to search for values that either Start With or Contain the typed text (v2017.3+).
 icon to choose a pre-defined value based on a formula programmed by the system administrator. (For example, First Day of Current Month or Friday of Last Week).
 or Move Item Down
  icons
icons icon to move the filter to the desired location
Formula Filters v2018.2+
Formulas may be used in the filter field allowing for much more powerful filter statements.
Consider the following example using data objects from the sample Northwind data set, to compare the OrderDate against a single date.
{Orders.OrderDate} > 01/01/2015
Now, Data Objects may be used in a formula when doing a filter operation. For example, calculating the revenue of an order line item by multiplying {OrderDetails.Quanity} by {OrderDetails.UnitPrice} and then applying a filter to select only those line items whose revenue is greater than $300.
{OrderDetails.Quantity}*{OrderDetails.UnitPrice} > 300
To add a Formula Filter in the Advanced Report Designer’s Filters dialog:
- Click the Add Formula button in the lower left to open the Formula Editor dialog.
Tip
Refer to Formulas for details about creating and editing formulas and using the Formula Editor.
Note
Certain functions are available in the Formula Editor that are not compatible with the context of formula filters, such as CellValue(), FilterValue(), Hyperlink, LoadImage() and PageNumber().
Prompting for Filter Values
If users should be able to select their own filter values when they run the report, set filters to Prompt For Value. In the Report Options, choose whether to let users change the operators and delete filters.
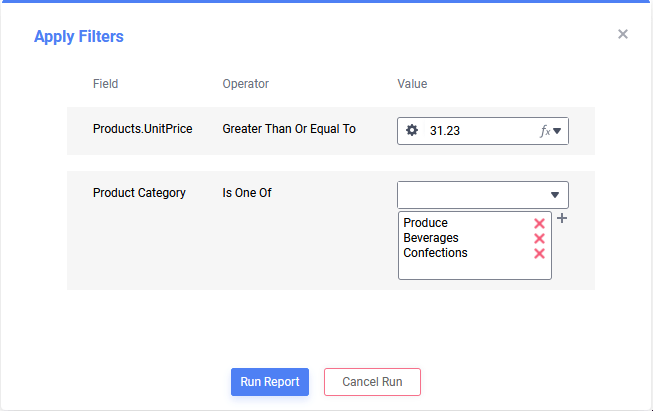
Prompting Filter Window with two filters: a Greater Than or Equal To filter for the product unit price and an Is One Of filter for one or more product categories
When creating prompting filters in the Report Filters dialog, it is not necessary to select filter values (step 4). But if values are provided, those values become the defaults in the prompting window.
If there are no valid filter values for a particular filter, either due to there being no records in the filter field or an incomplete filter dependency, a No values found matching the search criteria message will appear when opening the dropdown in either the Simple with Operator and Simple without Operator prompting filter windows.
Filter Dependency
Using Filter Dependency is a graceful way of preventing users from seeing a No Data Qualified message by choosing incorrect filter values. Filter Dependency is an optional feature that must be enabled by the system administrator before it can be used in reports. When Filter Dependency is enabled and a report contains at least two prompting filters, values for subsequent filter dropdowns will be determined by values chosen for the preceding filters in the dialog.
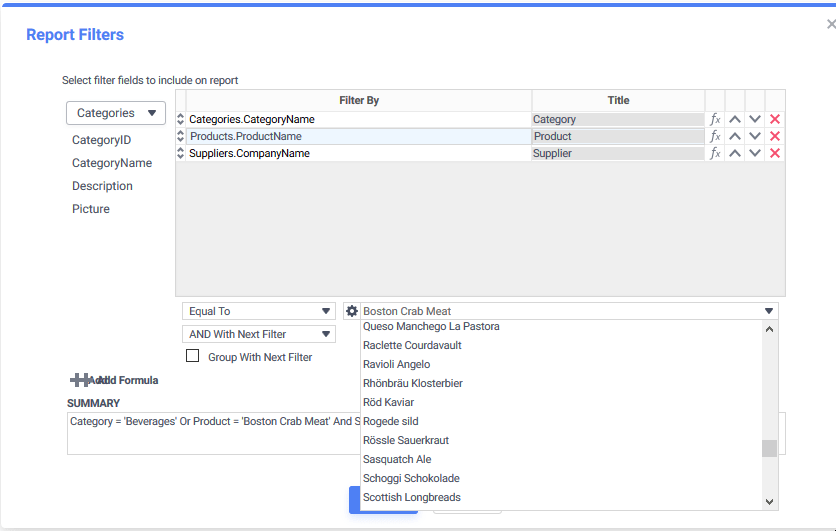
Consider an example with three filters: Category, Product and Supplier that are grouped together with the AND clause. In this case, the report will select rows when all of the filter conditions are met. If Category is chosen to be Meat/Poultry, dropdowns for Product and Supplier will be filtered by Category so that only Products in the Meat/Poultry category and Suppliers selling Meat/Poultry products can be chosen. If a Product value is further selected, then the dropdown for Supplier would be filtered by both Category and Product such that only a Supplier selling that particular product could be selected. This “cascading” effect continues from top-to-bottom for as many filters there are on the report.
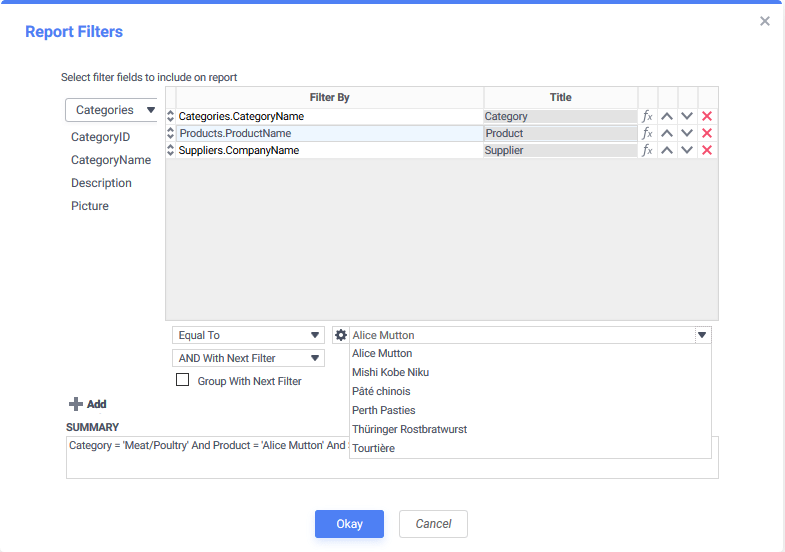
Only Products in the Meat/Poultry Category can be selected as the Product filter depends on the Category value.
Filter dependency only works in a top-to-bottom flow. That is, choosing a Product Name will not cascade upwards to the Category filter, it will only cascade down to the Supplier filter. For interactive filters on a Dashboard, filter dependency is determined by the order the filter tiles are added to the canvas.
If there is no value selected for Category, then the Product and Supplier dropdowns will show no values in the example above. This is because the filter being generated is CategoryName = “null”, and so no data is returned. When this occurs in a Simple with Operator or Simple without Operator prompting filter window, a No values found matching the search criteria message will appear when opening the dropdown.
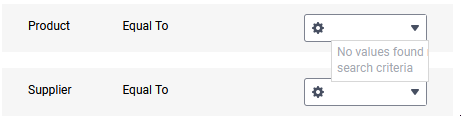
No values found matching the search criteria message will appear when opening a filter dropdown and there are no values to display
There are cases for data sets other than what our example uses where the subsequent filters will return data even if the preceding filter returns null. One such case is if there is an OR clause between two filters. For example, A OR B AND C. In this case, filter B is not dependent on the filter A, so selecting a value for filter A would not filter the dropdown for filter B. But C is still dependent on B in this case because of the AND in between them.
All Products are available regardless of Category because the filter statement now includes the OR clause between Category and Product
Filter Dependency will follow logical grouping in the filter statement created either with the Group With Next Filter checkbox or by using the Nesting Filter Groups keyboard shortcuts.
Important
Filter Dependencies only support one level of grouping and are not honored when the filters are included in the Common Prompt mode of a Chained Report.
Filter Logic and Grouping
Conjunctions
Standard Filters can be combined to form complex filtering phrases. Taking the examples from the beginning of this article a bit further, a filter can be setup to show “only the orders of products whose unit price is more than $10 AND were placed by any employee who was hired after 5/1/2008”. Note the emphasis on the word AND. To build a report that shows this kind of data, the original two filters are conjoined so that only orders that meet both criteria will apply.
Another way of combining filters is with an OR conjunction. For example, “show only the products whose Category is Beverages OR whose Category is Condiments”.
Filter conjunctions can also be combined together. Consider this complex filter phrase that uses four individual standard filters to return only service tickets that required a Return Material Authorization due to lightning or surge damage: “Include only the service tickets where the description contains ‘RMA’ OR the title contains ‘RMA’ AND the description contains ‘Lightning’ OR the description contains ‘Surge'”.
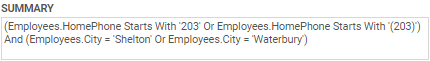
Example of a combined filter statement
To specify that a data row needs to satisfy any one of several filters:
- Click the Filter icon to open the Report Filters dialog.
- Change the order of the filters so they are consecutive, by either:
- clicking the Move Item Up or Move Item Down icons
- click and drag the Grip icon to move the filter to the desired location
- clicking the Move Item Up
- Select the first filter.
- Change AND With Next Filter to OR With Next Filter in the dropdown.
Notice that in the Summary field, the And between this filter and the next has changed to Or. - Repeat steps 2-3 for every filter except the last.
Note
The AND operator (AND With Next Filter) has higher precedence over the OR operator (OR With Next Filter). This means filters that are ANDed together will be evaluated first before those that are ORed together.
Examples
This filter will only show donations larger than $5,000 that were made today from the Telethon fundraising campaign
Campaigns.Campaign Name = 'Telethon 1' And Donations.Date = 'Today' And Donations.Amount >= '5000'
This filter will show donations larger than $5,000 and were made today or if the donor’s birthday is today. Since this is less restrictive, more results are returned.
Donations.Date = 'Today' Or Donors.birthday = 'Today' And Donations.Amount > '5000'
Grouping
Filters may be grouped together, to specify that a data row can match either one group of filters, or another group of filters, to show on the report.
To specify that a data row needs to satisfy any one of several groups of filters:
- Click the Filter icon to open the Report Filters dialog.
- Change the order of the filters so they are near their group mates, by either:
- clicking the Move Item Up or Move Item Down icons
- click and drag the Grip icon to move the filter to the desired location
- clicking the Move Item Up
- Select the first filter in the first group.
- Check the Group With Next Filter checkbox.
Notice that in the Summary field, there are now parentheses around this filter and the next. - Repeat steps 2–4 for every filter except the last in the first group.
- Select the last filter in the first group.
- Change AND With Next Filter to OR With Next Filter in the dropdown.
Notice that in the Summary field, the And between this filter and the next has changed to Or. - Repeat steps 2–7 for every group of filters. Skip step 7 for the last filter in the last group.
Nesting Filter Groups
Filter groups can be nested arbitrarily. This allows for more detailed control over grouping. The Summary field shows the actual statement used to filter the data. You can make arbitrary groupings by inserting parentheses manually at locations in the statement. Use the following keyboard shortcuts:
Important
Filter Dependencies only support one level of grouping.
Ctrl + [to add an opening parenthesis before the selected filterCtrl + ]to add a closing parenthesis after the selected filterCtrl + Shift + [to remove an opening parenthesis from before the selected filterCtrl + Shift + ]to remove a closing parenthesis from after the selected filter
