Advanced Reports: Sections (v2021.1+)
The sections of an Advanced Report define its appearance and pattern. Specifically, sections determine how frequently cell contents are repeated.
The appearance of a report is based on data that is not necessarily known at the time it is made. Reports are usually not fixed designs—the data, and the relationships it describes, are dynamic. Knowing which sections are suitable for different types of content is crucial for designing the best possible report.
Types of Sections
There are two general types of sections: Static and Dynamic. The difference is in the repetition of their cells.
The cells in a static section do not repeat according to the report data. Static sections are best used for information that is not related to data rows. For example, defining column headers that describe the type of data in each field, or a page number at the bottom of each page.
The cells in a dynamic section repeat according to the data that is returned to the report. Dynamic sections are suitable for showing content related to that data. For example, cells in a Detail section repeat for every composite data row in the report.
Static Sections
Report Headers, Page Headers, Page Footers and Report Footers are categorized as static because they do not repeat according to the data in the report; although they may repeat by other means. These sections are best used for report metadata. They can also be useful for boilerplate elements, such as logos, copyright notices, titles or disclaimers.
A typical report may have a report header with the title of the report, a page header with labels for each column, a page footer that uses the PageNumber() function or @pageNumber@ parameter to number the pages, and a report footer with summary information.
Page Header & Page Footer
The rows in the Page Header section appear at the top of every page of a report, and the rows in the Page Footer section appears at the bottom of every page of a report. Typically, the Page Header section is used to designate column headers for a report, and the Page Footer section is used to display the page number and/or confidentiality notices for a report.
Page Headers and Page Footers are not intended to perform calculations or display data fields. For this reason, a Page Header populated with a data field will only return the first line of data in that field; a Page Footer will return only the last line of data.
Page breaks are usually caused when the data in dynamic sections overflows the length of the page, determined by the Page Size and Orientation settings in the report’s General Options. Manual page breaks may also be added.
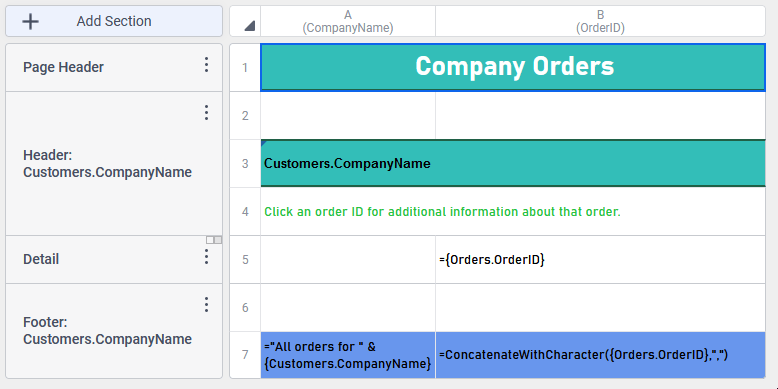
A report with a Page Header section in the Report Designer
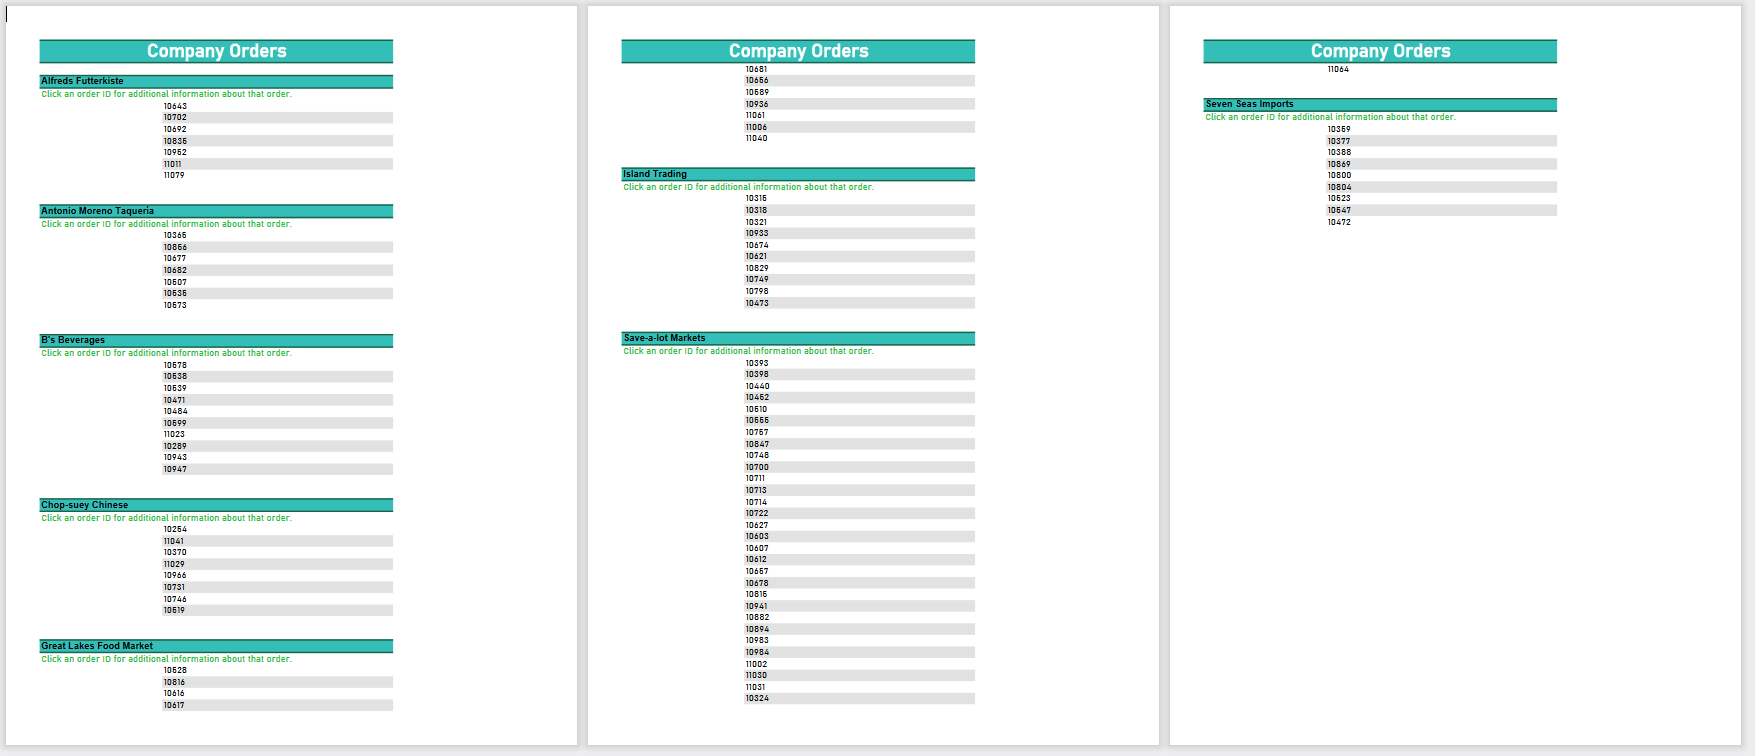
The “Company Orders” page header appears on top of each of the three pages in the report output
Tip
Excel and CSV export types have no pages. Page sections function the same as Report sections for these export types.
Even though page sections repeat, they are not considered dynamic sections because their repetition does not directly depend on the data. Thus they are not suitable for displaying data fields. Since there is no way of knowing ahead of time which data will appear on which page, these sections are not suitable for summarizing data with aggregates or visualizations.
A report may only have one page header and one page footer section, but each section may consist of multiple rows.
Report Header & Report Footer
Report Header and Report Footer sections appear once each, at the start and end of the report, respectively. Use these sections for introductory and concluding information. The report footer is ideal for summarizing all of the report data with aggregate formulas and visualizations.
Note
Report Headers appear below Page Headers.
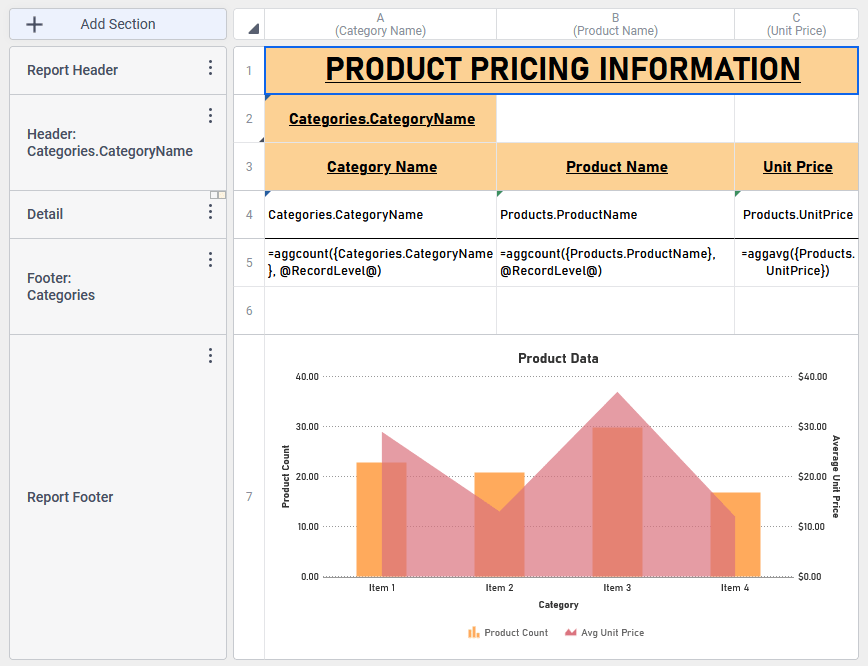
A report with both a Report Header and a Report Footer section in the Report Designer
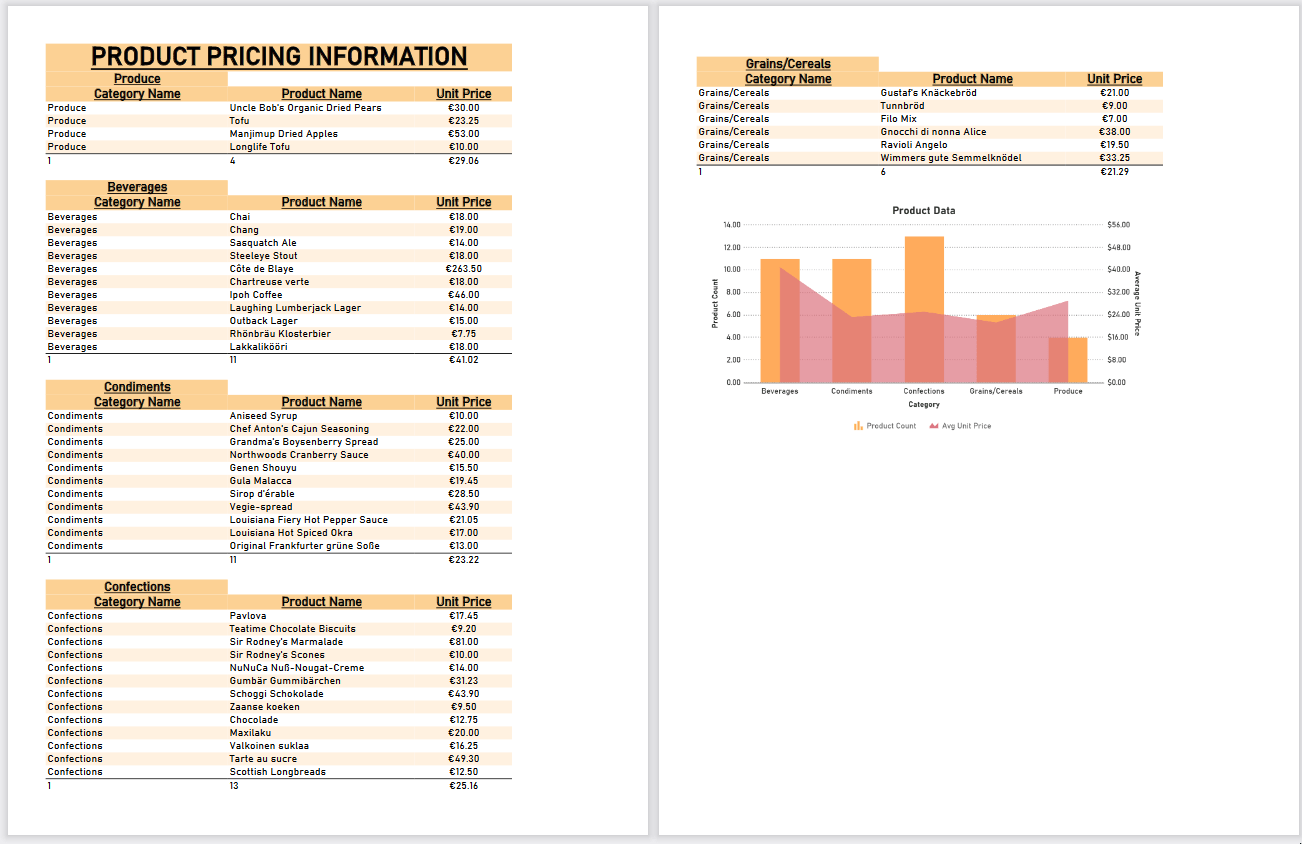
The “Product Pricing Information” Report Header and the Combination Chart in the Report Footer appear only once, at the start and end of the report, respectively.
A report may only have one report header and one report footer section, but each section may consist of multiple rows.
Dynamic Sections
Groups, Repeating Groups and Detail sections are categorized as dynamic because they repeat according to data in the report. These sections are best used for displaying and grouping data from data fields. Dynamic sections comprise the bulk of most tabular reports. Charts, maps, and gauge visualizations reference data fields in the dynamic sections.
The key for knowing how to use dynamic sections is knowing how the data will repeat in relation to the rest of the report.
Detail Sections
The rows in the Detail section repeat for each data row retrieved from the Data Object, and is the main section of most reports.
Detail sections are typically used for showing the actual data values. This is the main area of display for the bare report data. Aggregate formulas usually reference cells in the Detail section.
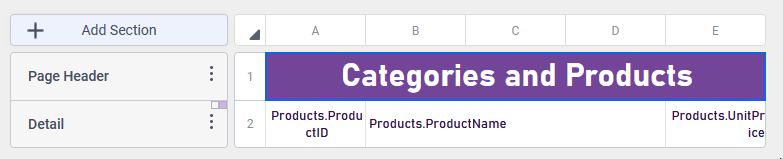
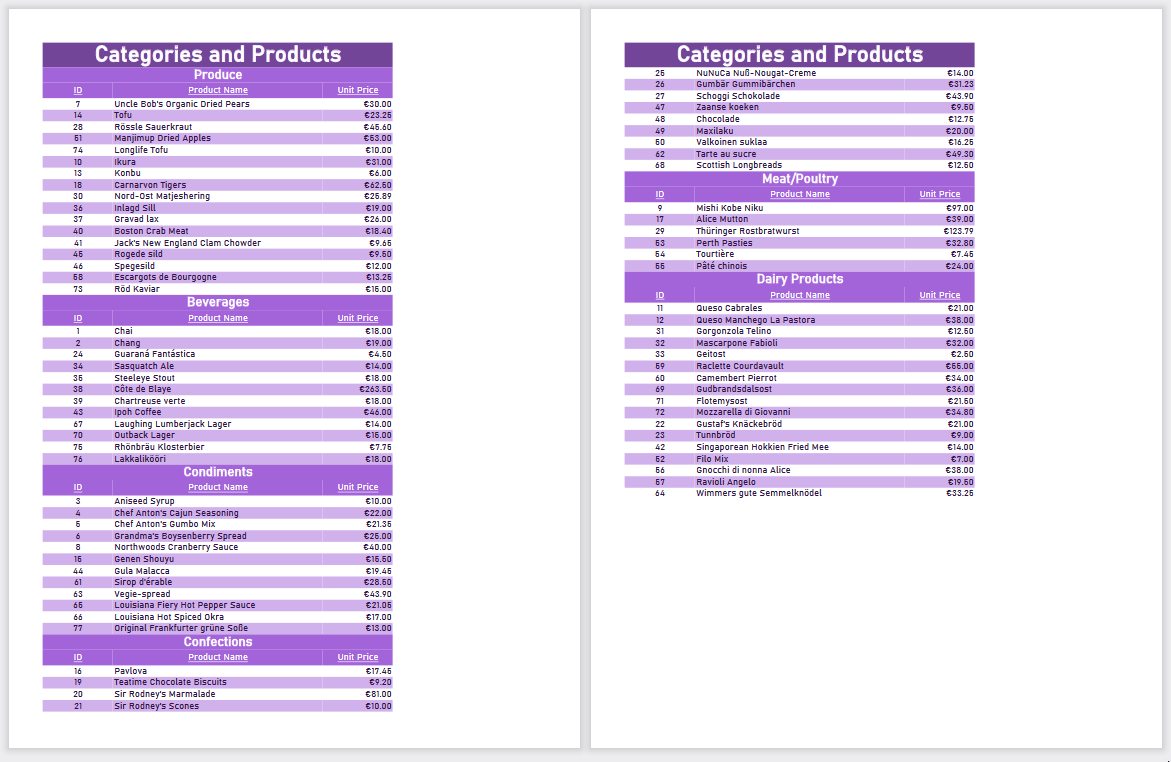
A simple report design with a Detail section containing Product ID, Name and Unit Price data fields
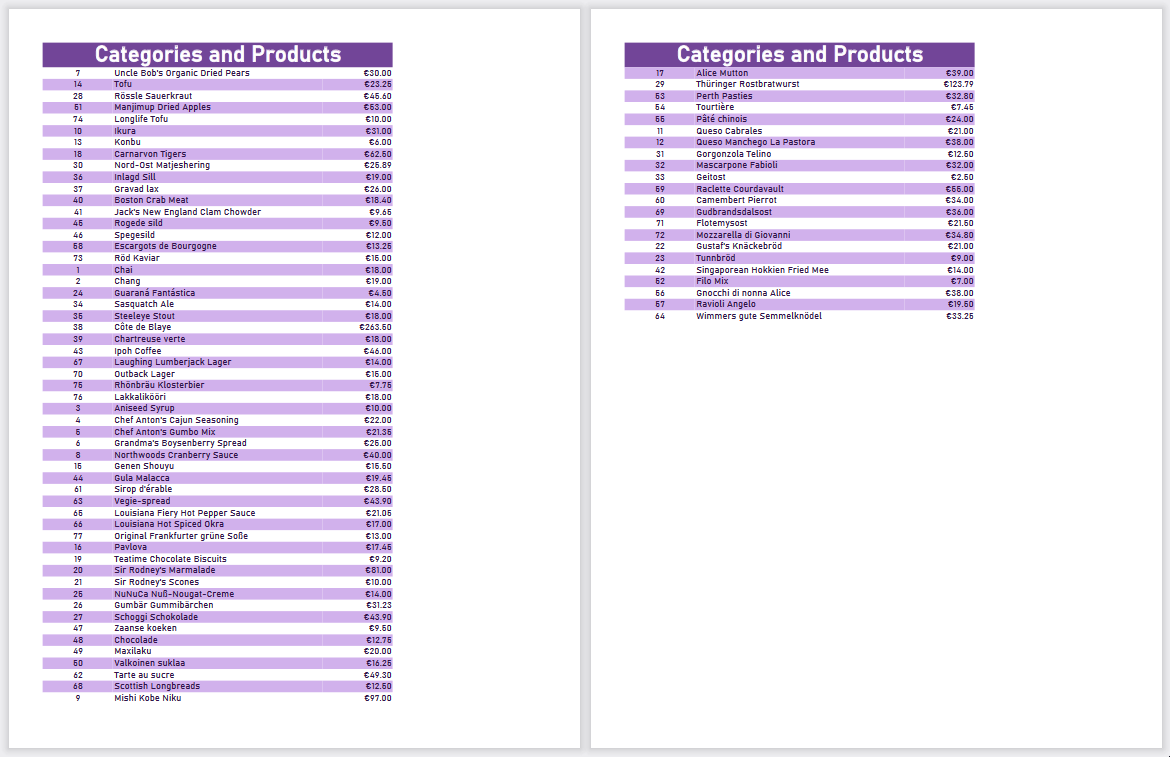
The Detail section expands to include all of the Product rows that match each Category so that the ID, Name and Unit Price of each product is displayed in the report
The number of rows that are displayed can be limited by using filters, duplicate suppression/hide repeating values and advanced join logic.
A report may only have one detail section, but it may consist of multiple rows. To have more than one detail section, use Repeating Groups.
Group Header & Group Footer
Groups are the primary way in which data is assembled into related categories that each share a unique attribute. Detail rows are arranged into the groups they belong to. The common attribute is defined by a sort.
The rows in a Group Header section will appear above the Detail section for each unique value of the sorted Data Field, or a formula. Typically, Group Header sections are used to display data as labels.
The rows in a Group Footer section will appear below the Detail section for each unique value of the sorted Data Field. Typically, Group Footer sections are used to calculate subtotals.
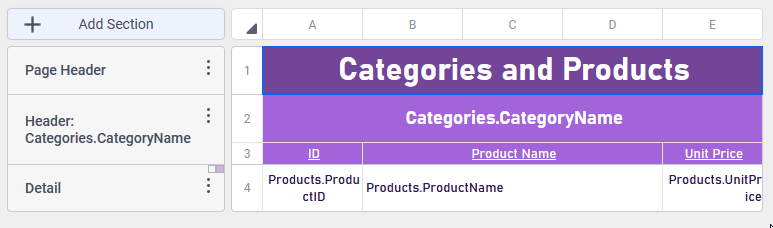
Products are now organized into groups based on their Category.
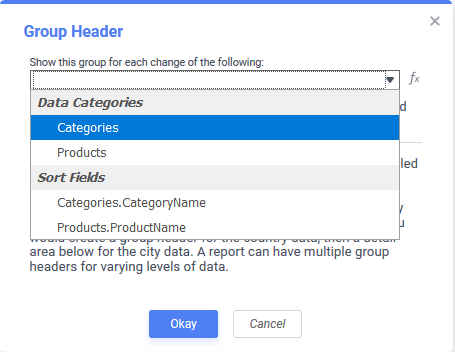
For each sort, the group can change on either on either the Data Object/Unique Key or the Sort Field.
- When grouping on a Data Object, the group breaks at each new instance of the data object’s unique key.
- When grouping on a Sort Field, the group breaks at each new value of that field.
Adding a Group Header section on a sort field v2021.2+
For example, instead of grouping by each Product, you may want to instead group by product quantity, so that products that are low or out of stock are grouped together. First, add a sort on the Products.Quantity field, then group by that field.
There may be multiple group sections, to add additional levels of stratification to the report. Each group requires a corresponding sort.
Tip
The order of the sorts has an effect on the way the data is arranged. Data is sorted by the first field, then any ambiguities are sorted by the second field, then any remaining ambiguities are sorted by the third, and so on. In general, order group headers by their associated sorts, and group footers in inverse order.
Repeating Groups
Repeating Groups are a way to organize and display data that contain multiple one-to-many relationships. Each repeating group has data from “many” category, grouped by the “one” category. The following diagrams demonstrate how this works.
Two Data Objects, X and Y, with a one-to-many relationship from X to Y, will display like so in a Detail section:
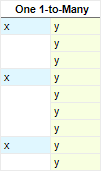
Each X has 1 or more Y. Category X has duplicates suppressed/repeating values hidden — this is similar to grouping on X.
If there is a third category, Z, with a one-to-many relationship from X to Z, there is not necessarily a relationship between Y and Z. So there may be blank rows with only Y or only Z.
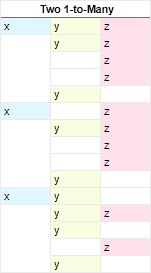
Each X has 1 or more Y, and 1 or more Z
There are two potential solutions. If there is a relationship between Y and Z, Advanced Joins can impose additional constraints so that only the rows with both Y and Z are shown. For more information, see Joins.
On the other hand, there may be no relationship between Y and Z, only between X and Y, X and Z. Or there may be a relationship, but it does not matter for this data set. Repeating groups can ignore that relationship and simply organize the data by X instead.
To do so, create two repeating groups for X, and put Y in the first, and Z in the second:
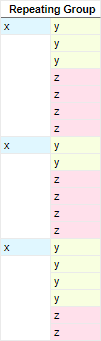
Each X repeats twice: once for Y, once for Z
Each repeating group section has its own group header, detail, and group footer sections. These follow the same principles as their main counterparts.
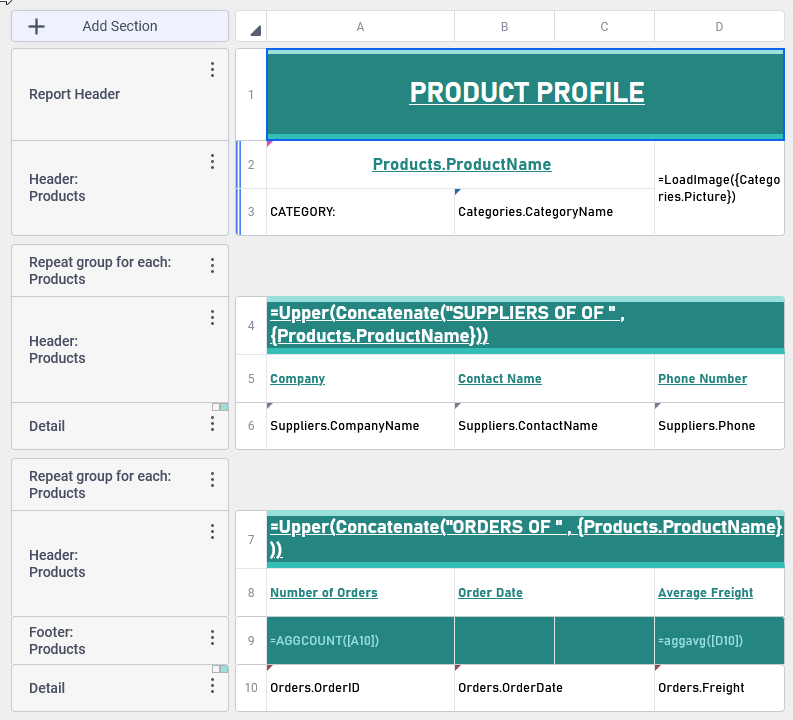
A report with two Repeating Groups that will display all of the Suppliers for each product, and the Orders for each product.
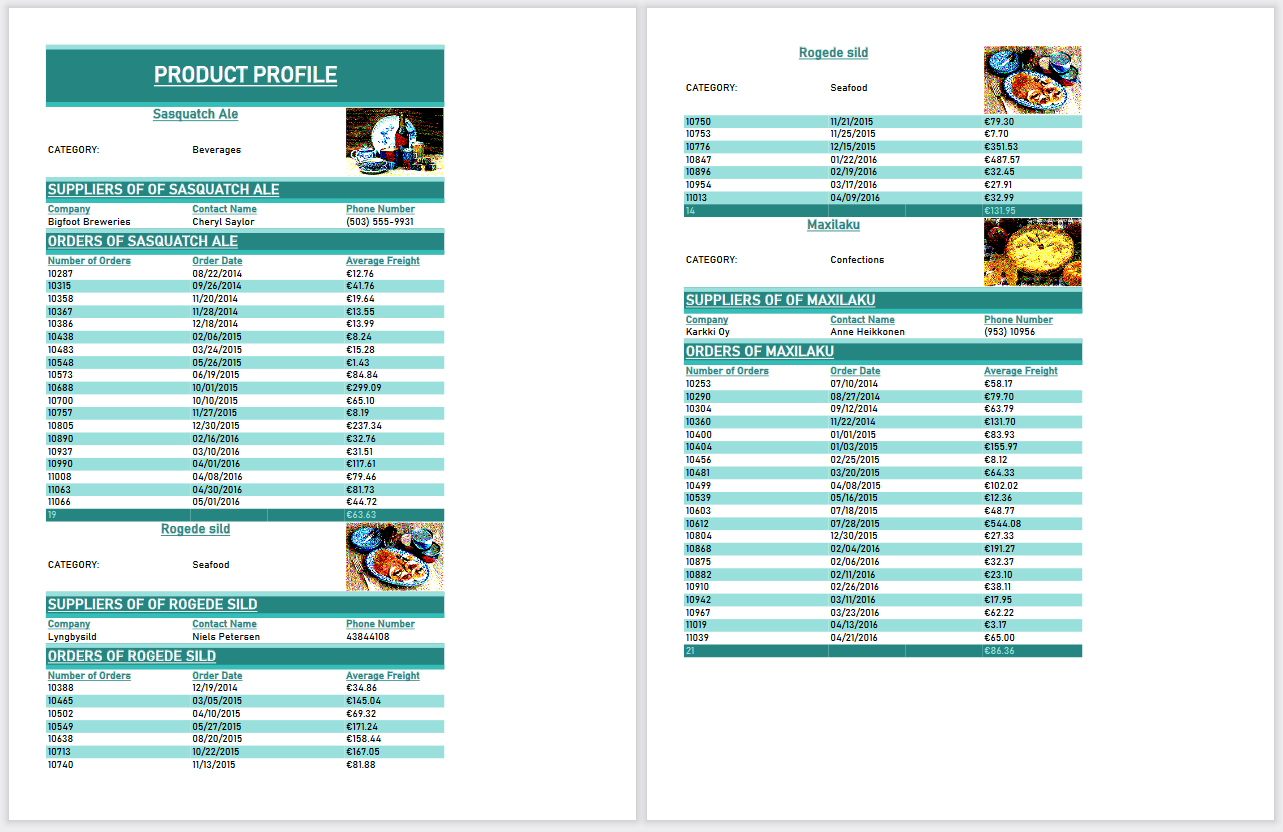
The output of the above report: three products with their suppliers and orders listed with two Repeating Group Sections
Create, Modify, Delete Sections
- To add a new section either:
- click the
 Add Section button
 - click a Section Menu icon then hover over Add Section
- right-click anywhere on a Section Header and hover over Add Section
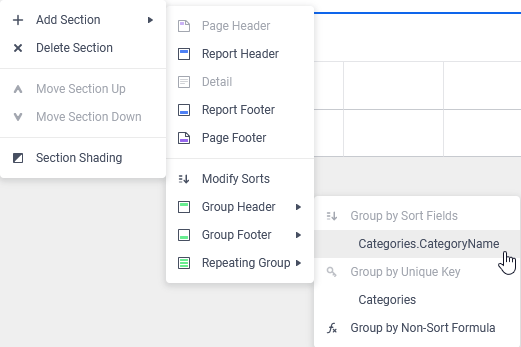
The Add Section menu will open with static sections on top and dynamic sections on the bottom. Click a section type to add to the design grid. If adding a Group Header, Group Footer or Repeating Group a minimum of one Sort must be defined for the report. In v2021.2+, click Add Sort/Modify Sorts to open the Sorts dialog. - click the
- To change the sort that a group header, group footer or repeating group breaks on, either:
- click the Section Menu icon on the section to be changed, then click Modify Section or Edit Group.
- right-click anywhere on the Section Header of the section to be changed, then click Modify Section or Edit Group
- click the Section Menu
- To re-arrange the order of group headers, group footers or repeating groups, either:
Notes
The order of the sorts as they appear in the Sorts dialog have an effect on the way the data is arranged. Moving the sections up and down will only change where in the report that data appears, not change its grouping/sorting order.
Report Headers, Page Headers, Detail, Page Footers and Report Footers have fixed positions.
- click the Section Menu icon on the section to be changed, then click Move Section Up or Move Section Down
- right-click anywhere on the Section Header of the section to be changed, then click Move Section Up or Move Section Down
- click the Section Menu
- To delete an existing section, either:
- click the Section Menu icon on the section to be removed, then click Delete Section
- right-click anywhere on the Section Header of the section to be removed, then click Delete Section
- click the Section Menu
 Add Section
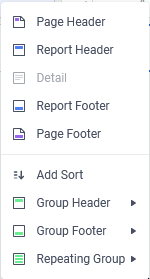
 Modify Section
 Move Section Up or
  Move Section Down
 Delete Section
Reprinting Group Headers
If the detail section of any given group spans multiple pages, it may be desirable to have the Group Headers repeated at the start of the next page.
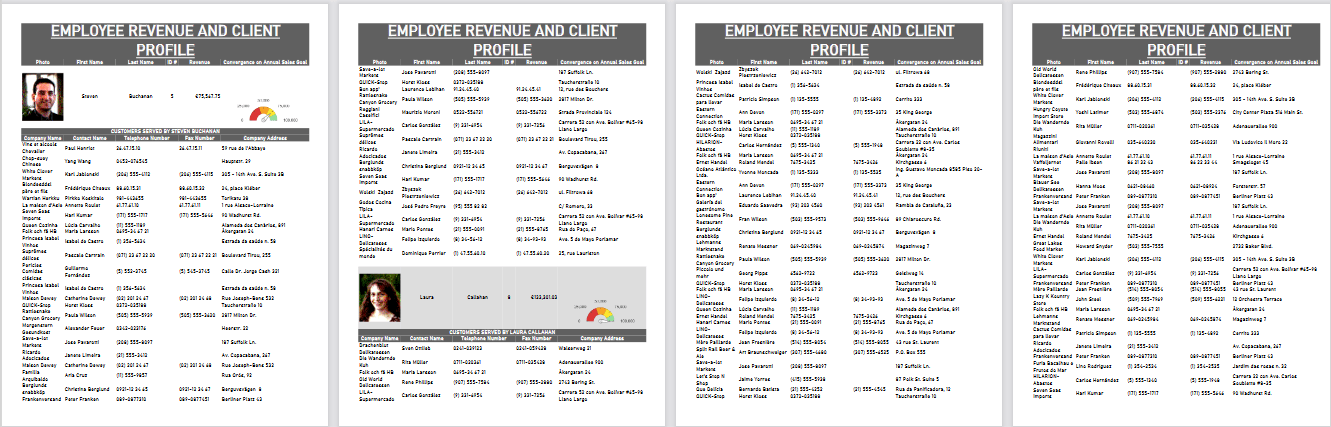
A report with a Group Header that includes an employee’s photo, name and sales goal visualization with a list of all of their orders
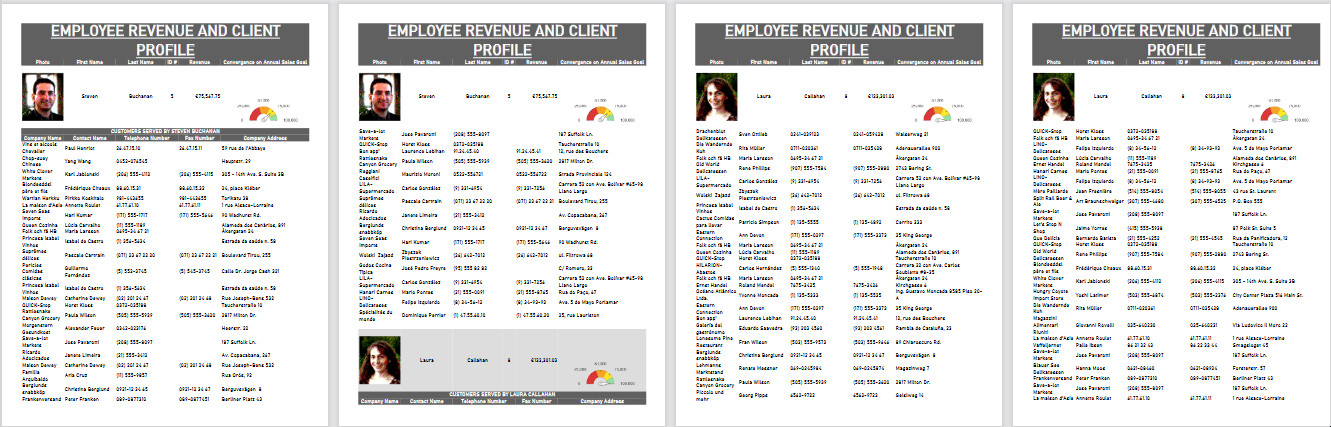
The same report with the Group Header reprinted at the top of each page as the Detail section flows to the following page. The employee information appears at the top of each page their order information appears
To reprint a Group Headers when the detail section continues onto another page:
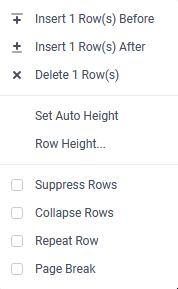
- Open the Row Menu by either:
- clicking the Row Menu icon on the row to be repeated
- right-clicking anywhere on the row number of the row to be repeated
- clicking the Row Menu
- Check the Repeat Row checkbox.
- Repeat steps 1–2 for any additional row that should repeat.
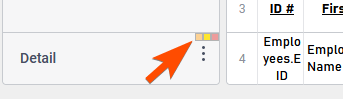
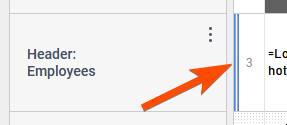
When rows are set to repeat, two blue stripes will appear on the left side of the row number. For example:
For additional information about the Row Menu, review the Rows Section of the Advanced Reports: Design Grid article.
Section Shading
Section shading creates alternating background colors for repeating elements in a section. Alternating colors applies to Detail and Group sections; for other sections, only one color can be used.
Section shading is overridden by the cell background color and by conditional formatting, if applied. Review the Advanced Reports: Cell Formatting article for more information.
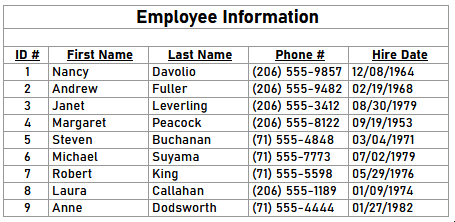
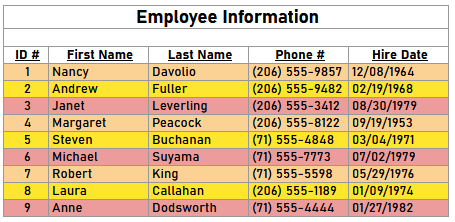
A basic report with no section shading applied
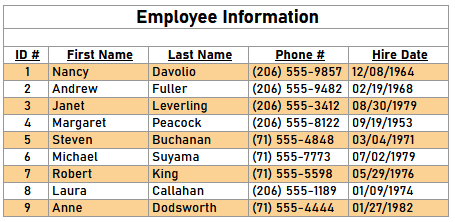
The same report with orange and white alternating section shading colors applied to the Detail section
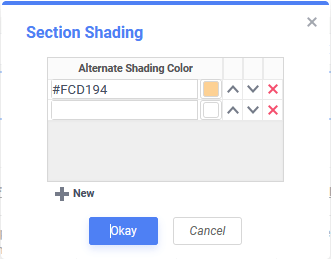
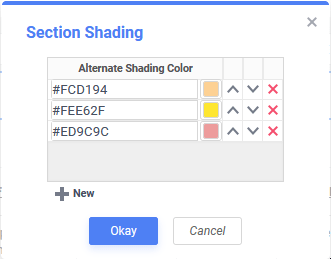
The Section Shading dialog for the above report
To add section shading:
- Open the Section Menu by either:
- clicking the Section Menu icon on the section to be changed
- right-click anywhere on the Section Header of the section to be changed
- clicking the Section Menu
- Click Section Shading to open the Section Shading dialog.
- Click New to add a new shading color. Any number of colors may be added.
- Click the Color Chooser icon, or enter a hexadecimal HTML color code to select a shading color.
- Use the up Move Item Up and Move Item Down icons to rearrange the order of the colors.
- Click the Delete icon to remove a shading color.
- Click Okay to close the dialog and apply the color settings.
 Section Shading to open the Section Shading dialog.
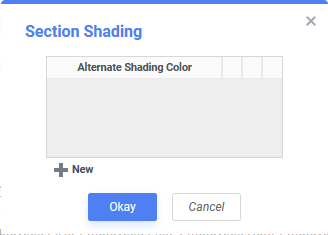
 New to add a new shading color. Any number of colors may be added.
 and Move Item Down
  icons to rearrange the order of the colors.
 icon to remove a shading color.
When Section Shading is applied to a section, a small indicator with the shading colors will be shown above the Section Menu  icon. For example: