ExpressView: Filtering (v2021.1)
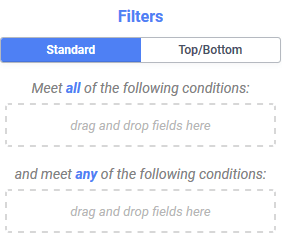
To show only data that matches certain criteria, filters can be added. Filters can also improve performance by only including relevant information. There are two kinds of filters that may be applied to an ExpressView: Standard and Top/Bottom.
Standard filters pair down data included in the report based on certain conditions. For example, “include only products in the Beverages category”. Top/Bottom filters can be used to restrict data included to only the top or bottom values. For example, “include only the top performing salesperson’s sales”, or “include only the two worst performing products”. A Top/Bottom filter can work in conjunction with standard filters or on its own.
Standard Filters
Standard Filters are comprised of three parts: the filter field, the operator and the values. To help design standard filters, consider a phrase that spells out what to include. For example: “Include only the products whose unit price is more than $10” or “Do not include any employee who was hired after 5/1/2008”.
The filter field is the data field that contains the data that will be filtered. In the above examples, the filter field would be the product ID number or employee hire date.
The operator sets the filtering action. The Standard Filters section of the Advanced Report: Filters article lists all of the available filter operators and how they work. In the above examples, the operators would be Greater Than for the products unit price and Less Than for the employee hire date.
The values are the criteria that the filter field must meet when compared by the operator. In the above examples, the values would be $10 and 5/1/2008. Some operators allow there to be more than one value.
Filter Conjunctions
Standard Filters can be combined to form complex filtering phrases. Taking the previous example a bit further, a filter can be setup to show “only the orders of products whose unit price is more than $10 AND were placed by any employee who was hired after 5/1/2008”. Note the emphasis on the word AND. To build a report that shows this kind of data, the original two filters are conjoined so that only orders that meet both criteria will apply.
Another way of combining filters is with an OR conjunction. For example, “show only the products whose Category is Beverages OR whose Category is Condiments”.
Filter conjunctions can also be combined together. Consider this complex filter phrase that uses four individual standard filters to return only service tickets that required a Return Material Authorization due to lightning or surge damage: “Include only the service tickets where the description contains ‘RMA’ OR the title contains ‘RMA’ AND the description contains ‘Lightning’ OR the description contains ‘Surge'”.
Adding a Standard Filter
Use the  Filters tab of the Properties Pane to add standard filters.
There are two drop zones for dragging-and-dropping fields to the tab. The Meet all of the following conditions zone is for adding filters that will AND together; the and meet any of the following conditions zone is for for adding filters that will OR together. If there are filters in both of the drop zones, the two drop zones are ANDed together. For example, the filter phrase for the figure below is “Show all of the work orders in the Service Department AND opened after 9/25/2019 AND the category is Door Entry OR Telephones”. This ExpressView would list only service tickets for problems related to door entry or telephones that were opened after September 25, 2019.
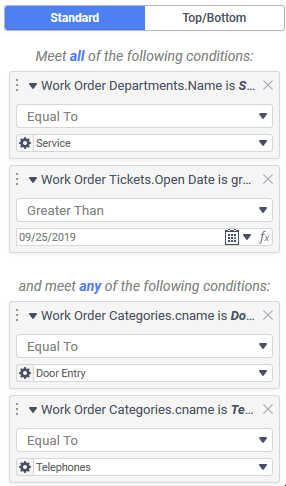
Complex conjoined standard filter example
Standard filters may be added on data field available, including formulas.
- Adding a filter requires first adding the filter field, by either:
- Dragging-and-dropping the filter field from the Data Objects Pane or from the canvas to the desired drop zone
- Using the Column Menu:
- Open the Column Menu by either clicking on the Column Menu
 icon or right-clicking on the column.
 - Click Filter By This. A new standard AND (meet all of the following conditions) filter will be added.
Tip
To use a formula as a filter field:
- Add a new formula column.
- Add the column as a filter as described above.
- Optionally remove the column from the report if desired. The filter will remain.
- Open the Column Menu by either clicking on the Column Menu
- Select the operator from the dropdown list. The default operator is Equal To.
- Directly enter or select the values to match the criteria in the filter. If the system administrator has enabled it, either:
- click the Choose Filter Value icon to show a list of potential filter values, or
- click the Choose Date icon to choose a date (for date type data fields only), or
- click the Filter Function icon to choose an available filter function. Filter functions are configured by the system administrator to extend filter value functionality from a static value to a dynamic value such as “The first day of next month” or “Friday of next week”.
- click the Choose Filter Value
 icon or right-clicking on the column.
 Filter By This. A new standard AND (meet all of the following conditions) filter will be added.
 icon to show a list of potential filter values, or
 icon to choose a date (for date type data fields only), or
 icon to choose an available filter function. Filter functions are configured by the system administrator to extend filter value functionality from a static value to a dynamic value such as “The first day of next month” or “Friday of next week”.
Examples
When implementing the example filter phrases in this section, the Filters tab of the Properties Pane will look as follows:
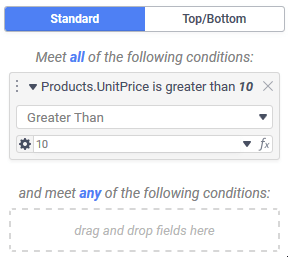
Show the products whose unit price is more than $10
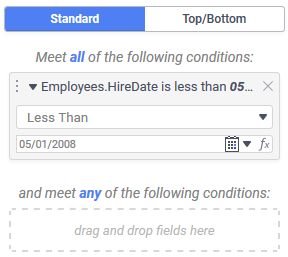
Do not include any employee who was hired after 5/1/2008
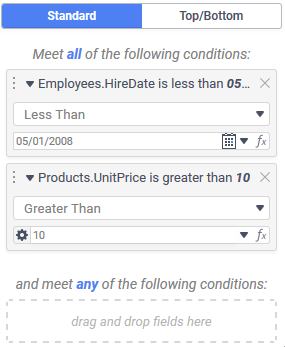
Show the products whose unit price is more than $10 AND include only employees whose hire date is before 5/1/2008
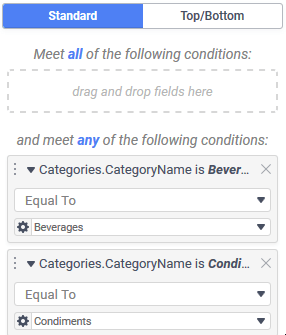
Show only the products whose category is Beverages or Condiments
Changing Standard Filters
Use the Filters tab of the Properties Pane to change standard filters.
The operator and values can be changed after the filter has been created. To change the filter field, remove the filter and add a new one.
Removing Standard Filters
Use the Filters tab of the Properties Pane to remove standard filters.
Click the Delete  icon in the top-right corner of the filter element. The filter will be instantly removed.
Top/Bottom Filters
Top/Bottom Filters, also known as Top N Filters can be used to filter the report to show the top or bottom values or aggregated summary of a field. For example: “Show only the best performing 2 salespeople in each region” or “Show the 5 smallest times to complete the manufacture of each model”. Top/Bottom filters can also be used to sort by aggregate and create a ranked list. For example, to list the Top 40 songs played on a radio station.
Note
Top/Bottom filtering is always done in memory. Therefore, they should be combined with standard filters when possible to improve performance for very large datasets.
- Check the Limit the report to the top/bottom values checkbox.
- From the Top/Bottom dropdown select either Top to show the largest or latest values or Bottom to show the smallest or earliest values.
- Enter an integer into the # field to specify the desired number of values (e.g. enter 2 to see the top 2 or bottom 2 values).
- Choose what to compare.
- Values — display the top N data values
- (aggregate function) — if there are groups on the ExpressView, choose one of the available aggregate functions, to display the top N of the aggregate. The available functions will differ based on the columns on the report.
- Select the data field or group field to filter from the Of… dropdown.
To optionally filter the top/bottom values of each group on the report, called a For Each Group:
Caution
Adding a For Each group will run the sort N times, where N is the number of Top or Bottom values to include in step 3 above. This may drastically negatively performance for large data sets.
- Click the Add Group button.
- Select one of the groups to group by from the dropdown list.
 Add Group button.
To remove a For Each Group click the Delete Dropdown  icon.
icon.
