Google Maps
Note
The system administrator can restrict access to this feature, therefore it may not be available in all environments. Contact the system administrator for more information.
The Google Maps Wizard allows interactive maps with highlighted data to appear in Advanced Reports. Geographical areas can be pinpointed or highlighted dynamically depending on report data.
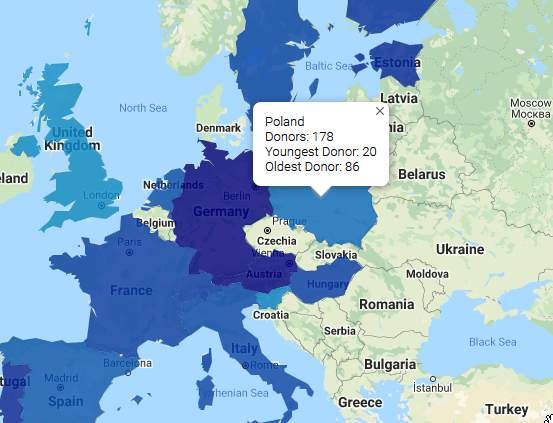
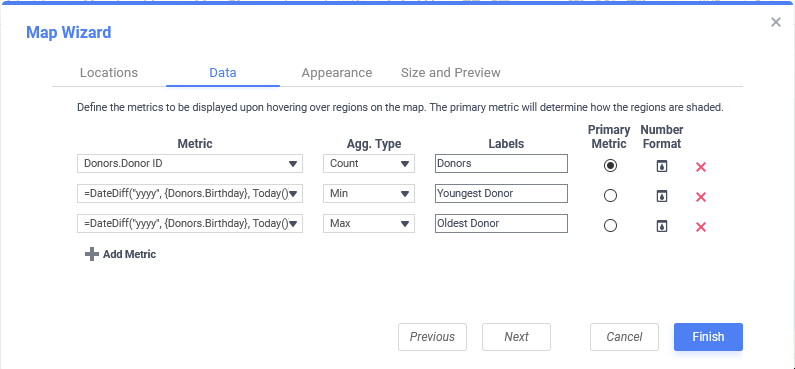
A sample Google Map visualization with a primary metric coloring the countries and three additional metrics displayed in a tooltip
This article is divided into two sections:
- Add a Google Map Visualization — instructions on creating a Google Maps visualization to an Advanced Report
- Interacting with Google Maps Visualizations — instructions for interacting with Google Maps visualizations in the Report Viewer
Add a Google Map Visualization
To add a Google Map to an Advanced Report:
- Select a Group Header, Group Footer, Report Header or Report Footer cell.
- Start the Google Maps Wizard:
- (pre-v2021.1) Click the Google Maps
 icon in the toolbar.
 - (v2021.1+) Click the Insert icon on the toolbar, then click Google Maps
- (pre-v2021.1) Click the Google Maps
 icon in the toolbar.
 icon on the toolbar, then click
  Google Maps
The Google Maps Wizard has four tabs: Locations, Data, Appearance, and Size and Preview outlined below.
Locations
Use the Locations tab to correlate data on the report with locations on the map.
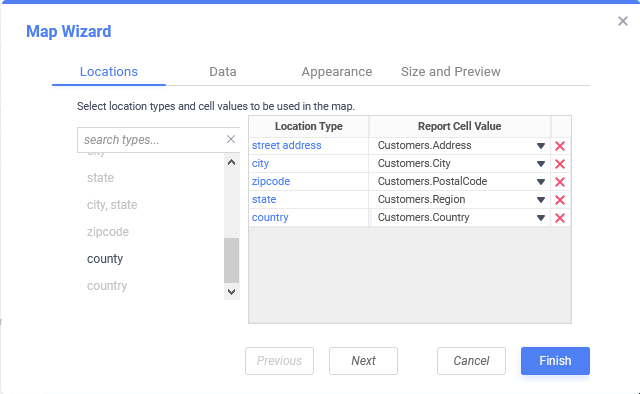
Locations tab of the Map Wizard dialog
- Add location types by either:
- dragging-and-dropping it to the selection pane,
- double-clicking it, or
- clicking on it then clicking the blue arrow icon
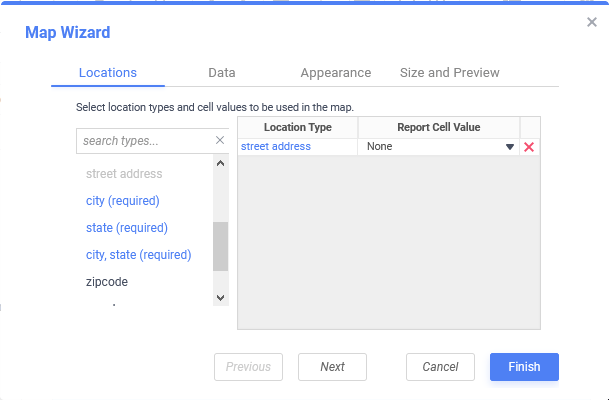
Note
Certain location types may require other types to be added or may prevent other types from being added.
Adding street address requires that city and state, or city, state be added as well
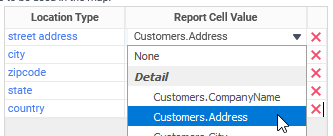
- Choose the content of the cell that correlates to each location type from the Report Cell Value column.
Remove a location type by clicking the Delete  icon at the end of the row.
Click Next to advance to the Data tab.
Data
In the Data tab determine what values, called metrics, will color and display on the map. The primary metric is used to color/shade the map and any number of additional metrics may be displayed in a tooltip when the mouse hovers over a region.
Data tab of the Map Wizard dialog
There must be a minimum of one metric. Click the  Add Metric button to add additional metrics. Click the Delete icon to remove a metric.
For each metric in the list:
- Use the Metric dropdown to select the report cell that contains its data.
- Select how to summarize (aggregate) the data from the Agg. Type dropdown:
- Sum — display the additive total of all data in the data field
- Count — display the number of rows in this data field. For example in the data set {1, 2, 3, 3, 4, 4} the count is 6.
- Distinct Count — display the number of unique rows in this data field. For example in the data set {1, 2, 3, 3, 4, 4} the distinct count is 4.
- Average — display the average (arithmetic mean) of this data field
- Minimum — display the smallest or earliest value of this data field
- Maximum — display the largest or latest value of this data field
- None v2018.2+ — displays the raw cell value of this data field.
- Enter a brief description in the Labels field.
- Select whether it is the Primary Metric. The Primary Metric is used to color/shade each region.
Note
Metrics with an Agg. Type except None may be the Primary Metric.
- Click the Number Format icon to change how the metric is displayed in the tooltip. This will open the Number Format dialog which works very similar to the Cell Format dialog in the Advanced Report Designer. The number formatting changes will only apply if the data field is numeric.
 icon to change how the metric is displayed in the tooltip. This will open the Number Format dialog which works very similar to the
 Hyperlinks v2018.2+
A hyperlink may optionally appear in the tooltip when zoomed in to the map at the drop pin level.
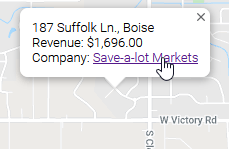
Demo of a hyperlink in a Google Map
To do this:
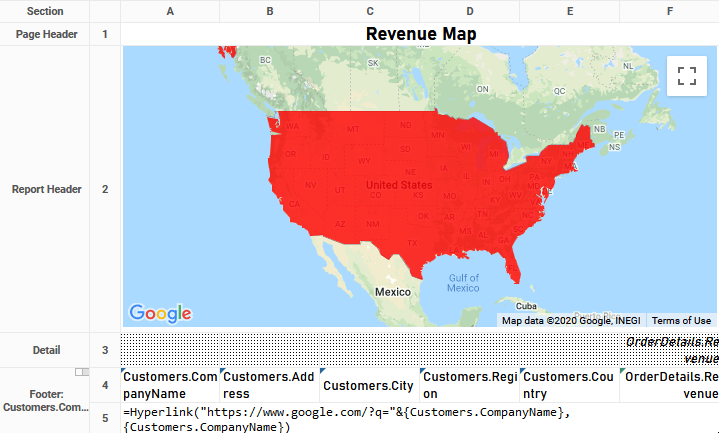
- A cell on the report must contain the Hyperlink function.
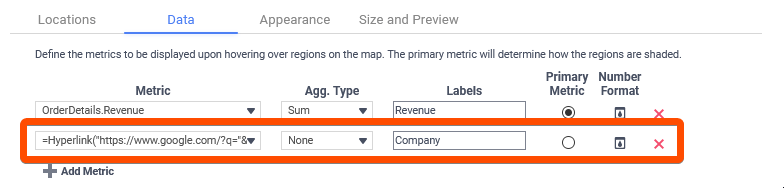
For example, the report below will launch a Google search for the company name when the link in the tooltip is clicked by using this formula:=Hyperlink("https://www.google.com/?q="&{Customers.CompanyName},{Customers.CompanyName}) - Add the cell with the hyperlink formula as a metric with Agg. Type set to None.
Note
Hyperlinks used for drop pins can be referenced from any section within the report; however, for dynamic linking, hyperlink information should be referenced from the detail section or a grouped section.
Click Next to advance to the Appearance tab.
Appearance
In the Appearance tab, determine the appearance of the metrics on the map.
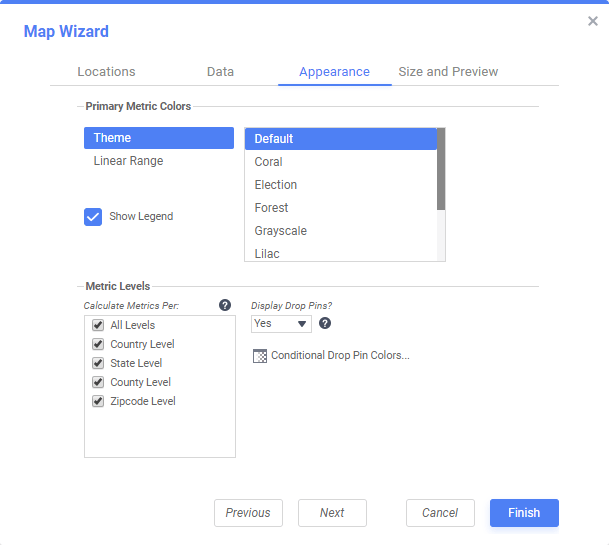
Appearance tab of the Map Wizard dialog
Primary Metric Colors
Choose a coloring style from the list on the left, either:
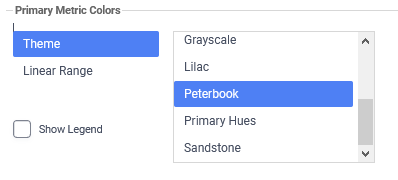
- Themes — a variety of named color themes are available (e.g. Coral, Election, Forest, etc…)
Selecting the Peterbrook theme
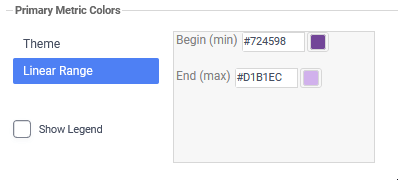
- Linear Range — choose a beginning (minimum) color and an ending (maximum) color. The application will automatically blend from the beginning to ending color based on the primary metric’s value. Click the color selector icon to open the color selector to choose a color.
Entering a linear color range
Check Show Legend to add a legend in the bottom left corner of the map.
Metric Levels
Calculate Metrics Per — select for which geographic levels to summarize the metrics. Hover the mouse over the More Information  icon to learn more about this function.
Display Drop Pins — select whether to display drop pins, which will appear on city, street address, or latitude/longitude locations. Hover the mouse over the More Information icon to learn more about this function.
Note
The summary function None requires a drop pin.
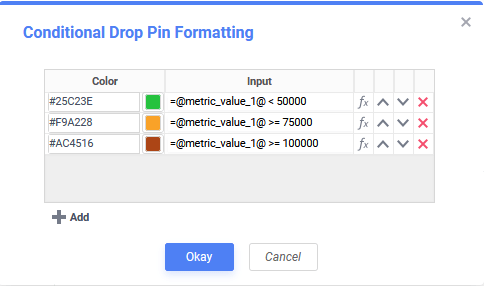
Conditional Drop Pin Colors — dynamically modify a drop pin color based on its value (v2018.2+). This action is similar to conditionally formatting cells in a report.
- Click the Conditional Drop Pin Colors… button.
- Click Add to insert a new conditional statement. Select a color that the drop pin will become when the condition is met.
- For each conditional color, add a condition that when true will color the drop pin. Click the Formula Editor icon to open the Formula Editor.The left side contains a list of the Conditional Drop Pin Parameters that includes:
- The metric values (listed in order of their creation),
- the Location Types that are defined in the Location tab
The right side contains all of the application’s built-in formulas. You can drag a data field or a formula to the Formula box, or type it in by hand. The editor also supports using parameters in the form @ParameterName@. For more information about building formulas, review the What are formulas? and Formula Basics articles.
The formula must return a logical true value to cause the drop pin to become conditionally colored.
Conditional Drop Pin Formatting that will color the pin red if the value of the first metric is less than 50,000; amber if it is less than or equal to 75,000; red if it is greater than 10000
- Click Okay to close the Conditional Drop Pin Formatting dialog.
 icon to open the Formula Editor.The left side contains a list of the Conditional Drop Pin Parameters that includes:
Click Next to advance to the Size and Preview tab.
Size and Preview
Set the size, initial view, and type of map to display in the Size and Preview tab. This view will also be used when the report is exported.
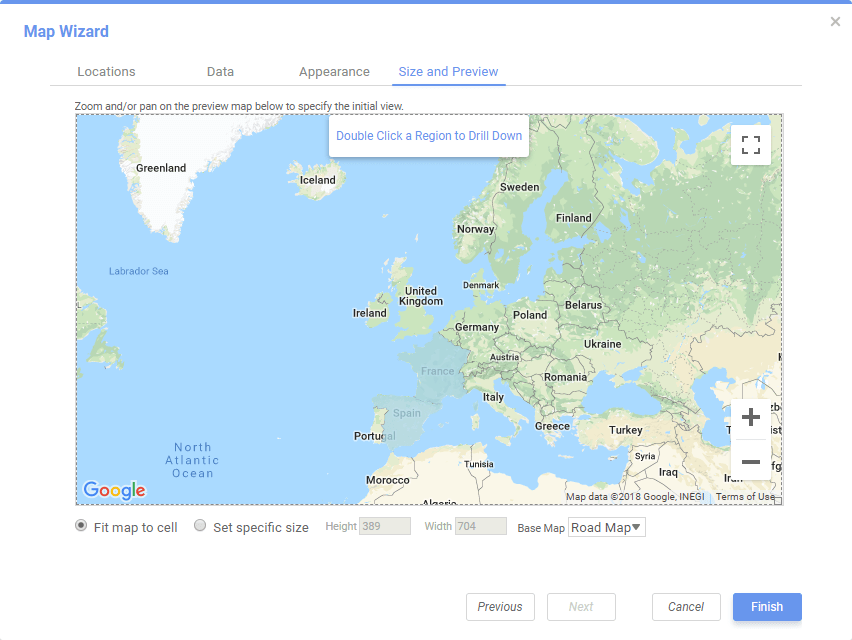
Size and Preview tab of the Map Wizard dialog
Note
The preview uses placeholder data values. It does not reflect the actual region shading.
Set the initial view of the map by panning and zooming to a location.
- Click-and-drag on the map to pan.
- Click the Zoom In and Zoom Out icons to change the zoom level.
- Double-Click on a region to drill down into the child regions (e.g. double-click on a state to see data by city)
 icons to change the zoom level.
Change the size of the chart in one of three ways:
- Drag-and-drop the resizing handle at the bottom-right corner.
- Check Fit map to cell and which will cause the map to fill its containing cell.
- Check Set specific size and enter a custom Height and Width in pixels
Select the style of map with the Base Map dropdown. Choose from:
- Road Map — displays the default road map view. This is the default map type.
- Terrain — displays a physical map based on terrain information
- Satellite — displays Google Earth satellite images.
- Hybrid — displays a mixture of road map and satellite views
Click Finish to add the completed visualization to the report.
Interacting with Google Maps Visualizations
On the first run, it may take a few minutes for the map to populate with data and for the metrics to be aggregated. A Loading Data message will appear in the top-left corner, then disappear once loading is completed.
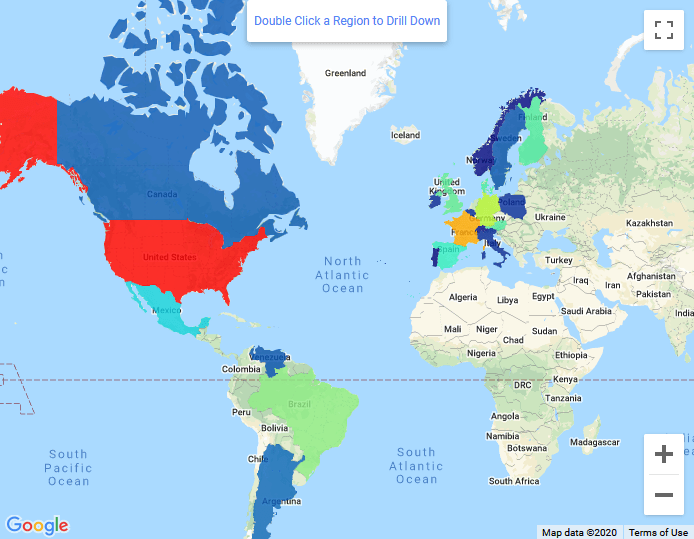
A Google Map visualization as it appears in the Report Viewer
Google Maps visualizations are interactive in a number of ways:
- Navigate through the map
- Click the Full Screen icon to open the map in a full screen view.
- Click-and-drag on the map to pan left, right, up and down.
- Click the Zoom In and Zoom Out icons, or scroll the mouse wheel to change the zoom level. At high zoom levels on Satellite and Hybrid map types two additional buttons appear:
- Click the Rotate map 90 degrees icon to rotate the map.
- Click the Tilt map icon to change the map’s tilt.
- Click the Rotate map 90 degrees icon
- Click the Full Screen
- Analyze the data presented
- Hover the mouse over a colored/shaded region to see a tooltip with the metric data. The color indicates the magnitude of the map’s primary metric.
- Double-Click on a region to drill down into the child regions (e.g. double-click on a state to see data by city). Click [Back] to move up one level.
- Other functions
Note
These functions are provided by Google and are not associated with the reporting application.
- Click Report a map error to report incorrect pin locations, missing roads and landmarks or wrong business, place or road information displayed on the map
- Click the Google logo in the lower-right corner to open the map in a new browser tab or window
 icon to open the map in a full screen view.
 to rotate the map.
 icon to change the map’s tilt.
Note
When an Advanced Report containing a Google Map visualization is exported to an output file type that supports visualizations (i.e. PDF, RTF or Excel) the map will be reset to the default view defined in the Size and Preview tab of the wizard.
