-
Reporting
-
-
- Advanced Options
- Advanced Reports: Categories (pre-2021.1)
- Advanced Reports: Design Grid (pre-2021.1)
- Advanced Reports: Joins
- Advanced Reports: Report Designer (pre-2021.1)
- Advanced Reports: Report Options
- Advanced Reports: Sections (pre-v2021.1)
- Advanced Reports: Sorts
- Advanced Reports: Using the Toolbar (pre-v2021.1)
- Cell Formatting
- Report Wizard
- Report Wizard: Categories
- Report Wizard: Filters
- Report Wizard: Layout
- Report Wizard: Name
- Report Wizard: Options
- Report Wizard: Sorts
- Show all articles ( 7 ) Collapse Articles
- Advanced Reports: CrossTabs
- Advanced Reports: Templates
- Building Your First Report
- Chained Reports
- Conditional Row Suppression
- Dealing with Duplicate Values
- Display Page Numbers
- Filters
- Keyboard Shortcuts
- Linked Reports (Drilldowns)
- Navigating the Application
- No Data Qualified Options
- Report Types
- Report Viewer
- Sorting by Aggregates
- User Preferences and Context Sensitive Help
- Show all articles ( 6 ) Collapse Articles
-
-
- Chart Advanced Features: Area
- Chart Advanced Features: Bar 2D
- Chart Advanced Features: Bar 3D
- Chart Advanced Features: Bubble
- Chart Advanced Features: Column 2D
- Chart Advanced Features: Column 3D
- Chart Advanced Features: Combination 2D
- Chart Advanced Features: Combination 3D
- Chart Advanced Features: Doughnut 2D
- Chart Advanced Features: Doughnut 3D
- Chart Advanced Features: Funnel
- Chart Advanced Features: Heatmap
- Chart Advanced Features: Line
- Chart Advanced Features: Pareto 2D
- Chart Advanced Features: Pareto 3D
- Chart Advanced Features: Pie 2D
- Chart Advanced Features: Pie 3D
- Chart Advanced Features: Pyramid
- Chart Advanced Features: Radar
- Chart Advanced Features: Samples
- Chart Advanced Features: Scatter
- Chart Advanced Features: Spark Column
- Chart Advanced Features: Spark Line
- Chart Advanced Features: Spline
- Chart Advanced Features: Spline Area
- Chart Advanced Features: Stacked Area
- Chart Advanced Features: Stacked Bar 2D
- Chart Advanced Features: Stacked Bar 3D
- Chart Advanced Features: Stacked Column 2D
- Chart Advanced Features: Stacked Column 3D
- Chart Advanced Features: Zoom Line
- Chart Advanced Features: Zoom Scatter
- Show all articles ( 22 ) Collapse Articles
- Bar Charts
- Chart Data Layout Types
- Charts and the Chart Wizard
- Displaying Null Values in Charts
- Gauges
- GeoCharts
- Google Maps
- Heatmap Charts
- Key Performance Indicator (KPI)
- Line Charts
- Pareto Charts
- Pie, Doughnut, Pyramid, and Funnel Charts
- Scatter and Bubble Charts
- Spark Charts
- Tabular Visualizations
- Show all articles ( 5 ) Collapse Articles
-
-
-
- Dashboard Designer (v2019.2+)
- Dashboard Designer: Existing Report Tiles (v2019.2+)
- Dashboard Designer: Filters (v2019.2+)
- Dashboard Designer: Image Tiles (v2019.2+)
- Dashboard Designer: Parameters (v2019.2+)
- Dashboard Designer: Samples (v2019.2+)
- Dashboard Designer: Text Tiles (v2019.2+)
- Dashboard Designer: URL Tiles (v2019.2+)
- Dashboard Designer: Visualization Tiles (v2019.2+)
- Dashboard Viewer (v2019.2+)
- Exporting Dashboards (v2019.2+)
- Show all articles ( 1 ) Collapse Articles
-
-
- ExpressView: Aggregating/Summarizing Data (v2021.1+)
- ExpressView: Exporting (v2021.1+)
- ExpressView: Filtering (v2021.1)
- ExpressView: Formula Columns (v2021.1+)
- ExpressView: Grouping (v2021.1+)
- ExpressView: Introduction (v2021.1+)
- ExpressView: Sorting (v2021.1+)
- ExpressView: Visualizations (v2021.1+)
-
-
- Aggregate Functions
- Arithmetic and Geometric Functions
- Database and Data Type Functions
- Date Functions
- FilterValue and General Format Best Practices
- Financial Functions
- Formatting Functions
- Formula Editor
- Internal Parameters
- JSONExtract Function
- List of Functions
- Logical Functions
- Other Functions
- String Functions
- What are formulas?
- Show all articles ( 5 ) Collapse Articles
-
-
Administrators
-
- Advanced Joins
- Amazon S3 File Storage
- Application Settings
- Automatic Database Discovery
- CData Drivers
- Config File XML & API Setting Reference (General Nodes)
- Config File XML Reference (All Nodes but General)
- Configuring Remote Report Execution Host for Azure App Service Deployments
- Considerations When Sizing an Exago System
- Database Aggregation
- Evaluating Exago - Linux
- Evaluating Exago - Windows
- Exago Installation Manifest
- Execution Caching
- Exploring Exago Technology
- Hidden Flags
- Inline Frame or JavaScript API?
- Installing and Configuring the REST Web Service API
- Installing Optional Features
- Managing the dbconfigs.json File
- Manual Application Installation
- Moving Files Between Storage Management Databases
- Multi-Tenant Environment Integration
- Multiple Data Models
- Report-Level SQL Objects
- Scheduling Reports
- Security Checklist
- Set Up Exago in a Web Farm
- Step 1: Install and Configure
- Step 2: Integrate
- Step 3: Install and Configure the Scheduler Service
- Step 4: Administration Console and API
- Step 5: Extensions
- Storage Management: Custom Implementation
- Storage Management: Database Schema
- Storage Management: Getting Started
- Storage Management: Introduction
- Storage Management: Transitioning from Legacy Storage Methods
- Storage Management: Utility (v2020.1)
- Storage Management: Utility (v2021.1+)
- Table-Valued Functions
- Technical Specifications
- User Identification
- Using SQLite Data Sources
- Vertical Table Support
- Windows Registry Changes
- Show all articles ( 36 ) Collapse Articles
-
- What's New in Version 2021.2
- Performance Enhancements in Version 2019.1
- Support and Maintenance Policy
- Time Zone Calculation Enhancements in v2019.1
- Updating Recommendations
- Updating to the Latest Version (Potentially Breaking Changes)
- What's New in Version 2019.1
- What's New in Version 2019.2
- What's New in Version 2020.1
- What's New in Version 2021.1
-
- Constants and Enumerators
- Executing Reports with the API
- List of REST Endpoints
- REST - Batch
- REST - Config Settings
- REST - Data Joins
- REST - Data Objects
- REST - Data Sources
- REST - Folders
- REST - Functions
- REST - GetExecute
- REST - Getting Started
- REST - Introduction
- REST — Parameters
- REST - Role Security
- REST - SchedulesV2
- REST - Server Events
- REST - Sessions
- REST - Storage Management
- REST Updates
- Using JSON
- Show all articles ( 11 ) Collapse Articles
-
- .NET API Documentation
- .NET API General Reference
- .NET Sample Code
- Constants and Enumerators
- Introduction to the .NET API
- List of .NET API Resources
- Load Reports in the .NET API
- Supply SQL for New Reports in the API
- Using the Administration Console and Exago API
- WebReports.Api
- WebReports.Api.Common
- WebReports.Api.Composite.Chained
- WebReports.Api.Composite.Dashboards
- WebReports.Api.Data
- WebReports.Api.Reports
- WebReports.Api.Roles
- WebReports.Api.Scheduler
- WebReportsDebug.xml
- Show all articles ( 8 ) Collapse Articles
-
- Configuration File Options and Optimizations
- High Availability
- Incremental Loading
- Intro to Performance and Scaling
- Measuring Database Network Latency
- Monitoring Database Schema
- Monitoring Scheduler Load
- Monitoring: Setup
- Monitoring: System Overview
- Special Cartesian Processing
- Tracking Execution Frequency with Monitoring
- Show all articles ( 1 ) Collapse Articles
-
- Adding Custom Items to the Report Tree
- Adding Fonts to Exago
- An Overview of Exago Extensions
- Application Themes
- Assembly Data Sources
- Create a Custom ExpressView Theme
- Create a Custom ExpressView Theme (v2021.1+)
- Custom Context Sensitive Help
- Customizing Getting Started Content
- Displaying User Messages
- Exago Theme Maker
- Excel: Grouping on Separate Worksheets
- Getting Started with Application Themes
- HTML Tag Sanitization
- Multi-Language Support
- Remote Execution
- Report and Folder Storage/Management
- Scheduler Queue
- SessionInfo
- Styling Exago
- Styling the Home Page
- Themes
- Show all articles ( 12 ) Collapse Articles
-
- Global Event: OnAfterLoadReportsList
- Global Event: OnAfterReportExportSuccess
- Global Event: OnConfigLoadEnd
- Global Event: OnConfigLoadStart
- Global Event: OnDataCombined
- Global Event: OnDataFieldsRetrieved
- Global Event: OnExceptionThrown
- Global Event: OnExecuteSqlStatementConstructed
- Global Event: OnExportCsvCell
- Global Event: OnFilterSqlStatementConstructed
- Global Event: OnGetUserPreferences
- Global Event: OnLoadReportParameters
- Global Event: OnOkFiltersDialog
- Global Event: OnOkParametersDialog
- Global Event: OnParameterSqlStatementConstructed
- Global Event: OnRenameFolderEnd
- Global Event: OnRenameFolderStart
- Global Event: OnReportExecuteEnd
- Global Event: OnReportExecuteInit
- Global Event: OnReportExecuteStart
- Global Event: OnReportFailValidation
- Global Event: OnReportSaveStart
- Global Event: OnScheduledReportComplete
- Global Event: OnScheduledReportExecuteStart
- Global Event: OnScheduledReportExecuteSuccess
- Global Event: OnSetUserPreferences
- Global Event: OnWebServiceExecuteEnd
- Introduction to Server Events
- List of Server Events
- Show all articles ( 19 ) Collapse Articles
-
-
How To
-
- .NET and REST APIs
- Batch REST API
- Custom Aggregate Functions
- Custom Columns and CrossTabs
- Custom Dialogs
- Custom Filter Functions
- Custom Functions
- Custom Interactivity via HTML & Action Events
- Customizing Color Picker
- Dashboard Updates in v2021.1
- Data Formatting
- Date Check Custom Functions
- Dynamic Rank Custom Function
- Filters
- Folder Management
- High Availability
- JavaScript API
- JavaScript API Filters
- Joins for Admins
- Linux Installation
- Multi-Tenanting
- Multiple Data Models, Cloned Data Objects & Vertical Tables
- Parameters
- REST Web Service API Setup & Security
- Roles
- Scheduler Configuration
- Security Settings
- Server Events
- Share by Link
- Storage Management Customization
- Storage Management Migration
- Storage Management Overview
- Storage Management Permissioning
- Stored Procedures
- Time Zone Handling
- Troubleshooting for Admins
- Upgrading
- v2018.2 User Preferences
- v2019.1 Configuration Changes
- v2019.1 Small Enhancements
- Visual Integration and Localization
- Show all articles ( 31 ) Collapse Articles
-
- User Support Lab - 3D Charts
- User Support Lab - Advanced Grouping
- User Support Lab - Chained Reports
- User Support Lab - Chart Data Layouts
- User Support Lab - Complete Report Design
- User Support Lab - Conditional Formatting
- User Support Lab - Crosstab Reports
- User Support Lab - Dashboards v2019.2
- User Support Lab - ExpressView
- User Support Lab - Filter by Formula
- User Support Lab - Filters
- User Support Lab - Formatting Tips and Tricks
- User Support Lab - Formulas
- User Support Lab - Formulas in ExpressView
- User Support Lab - Interactive Reports
- User Support Lab - Joins for Report Writers
- User Support Lab - Key Performance Indicators (KPIs)
- User Support Lab - Linked Reports a.k.a Drilldowns
- User Support Lab - Mapping
- User Support Lab - Multi-Series Charts
- User Support Lab - New Features v2018.2
- User Support Lab - No Data Qualified
- User Support Lab - Repeating Data
- User Support Lab - Report Scheduler
- User Support Lab - Report/SQL Relationship
- User Support Lab - Templates
- User Support Lab - Themes
- User Support Lab - Train the Trainer
- User Support Lab - Train the Trainer Advanced Reports
- User Support Lab - Train the Trainer ExpressView
- User Support Lab - Using ExpressView as a Data Discovery and Troubleshooting Tool
- Show all articles ( 21 ) Collapse Articles
-
- Adding a SQL Datasource
- Configuring a Stored Procedure Pt 1
- Configuring a Stored Procedure Pt 2
- Configuring a Table or View Pt 1
- Configuring a Table or View Pt 2
- Configuring IIS
- Configuring the REST Web Service [Linux]
- Configuring the REST Web Service [Windows]
- Configuring the Scheduler [Linux]
- Configuring the Scheduler [Windows]
- Installing Exago on Linux [Apache]
- Installing Exago on Linux [NGINX]
- Installing Exago on Windows
- Installing REST [Linux]
- Installing REST [Windows]
- Installing the Scheduler [Linux]
- Installing the Scheduler [Windows]
- Integration Example
- Introduction to Technical Training Series
- Programmable Object Settings
- Roles
- Storage Management Permissioning and Setup
- Show all articles ( 12 ) Collapse Articles
-
- Basic Training 01. Introduction
- Basic Training 02. ExpressView
- Basic Training 03. Advanced Reports
- Basic Training 04. Sections
- Basic Training 05. Formatting
- Basic Training 06. Formulas
- Basic Training 07. CrossTab Reports
- Basic Training 08. Charts
- Basic Training 09. Filters
- Basic Training 10. Conditional Formatting
- Basic Training 11. Dashboards
- Basic Training 11a. Dashboard Visualizations
- Basic Training 12. Practice Exercises
- Show all articles ( 3 ) Collapse Articles
-
-
Resources
Scatter and Bubble Charts
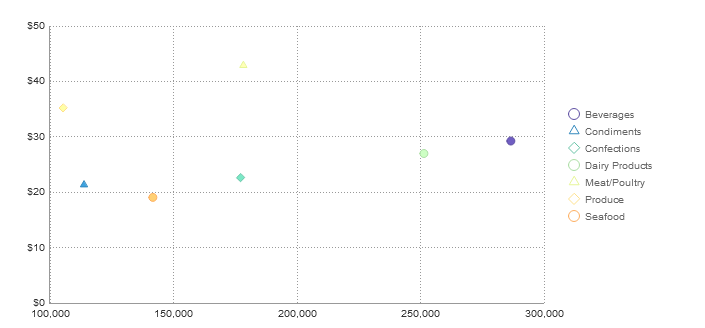
Scatter
Scatter charts use pairs of data values as coordinates for points on a grid. They are often used to find relationships between two variables in a set of data. Scatter charts can be single-series (one set of points) or multi-series (multiple sets of points). On a multi-series chart, series are differentiated by point color and shape.
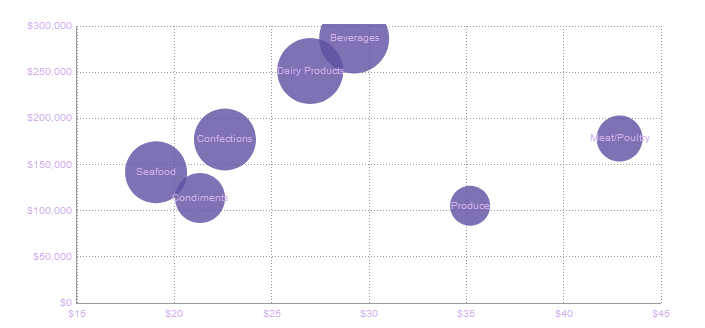
Bubble
Bubble charts are a variation of a Scatter chart. They use pairs of data values as coordinates for “bubbles” on a grid, and a third data value for the size of the bubble. They are often used to find relationships between three variables in a set of data. Bubble charts can be single-series (one set of bubbles) or multi-series (multiple sets of bubbles). On a multi-series chart, series are differentiated by bubble color.
0 out of 5 stars
| 5 Stars | 0% | |
| 4 Stars | 0% | |
| 3 Stars | 0% | |
| 2 Stars | 0% | |
| 1 Stars | 0% |
