What’s New in Version 2019.2
Dashboard Upgrades
The hallmark of v2019.2 is a complete re-design of our Dashboard Designer and Dashboard Viewer tools. More specifically:
Designer Workflow
We’ve made the workflow for designing Dashboards much simpler. This means less time building and more time working with your data. Building a Dashboard takes you through a left-to-right workflow on screen:
- Add tiles from the New Tile menu on the top-left of the Designer.
- Place the tiles on the canvas as you’d like
- Interact with the tiles in a newly designed Tile Properties Pane on the right side of the screen
Visualization Overhaul
We’ve overhauled charts and visualizations built directly on the Dashboard canvas. Dashboard visualizations are now based on Advanced Reports instead of ExpressView. This means that the flexible sorting, filtering, formulas and aggregation offered by the Advanced Report Designer are now available to Dashboard Visualizations. But this doesn’t mean that building visualizations on the Dashboard is difficult—on the contrary. Meaningful, attractive and easy to interpret visualizations can be built in as few as four steps!
Filter and Parameter Menu
The Filters and Parameters menu in the Dashboard Designer has been made easier to use by grouping all content together. This Filters menu shows two Interactive Filters on a Dashboard, as well as an Imported filter from one of the reports on the canvas:
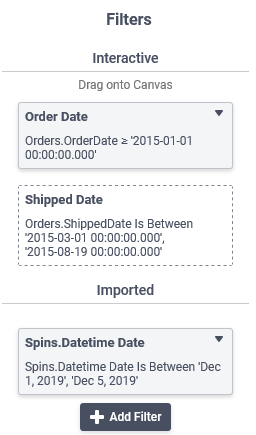
Filters and Parameters contained on reports with the same data field or name will automatically consolidate into a “stack”. This allows a cleaner, more intuitive filtering and interaction experience in both the Dashboard Designer and Dashboard Viewer. When filters and parameters automatically consolidate, they group together so that changing their Value will affect all of the tiles on the canvas simultaneously. Of course, this consolidation can be broken to allow granular customization as well.
The documentation on Dashboard Filters and Dashboard Parameters includes information about how these new menus work in greater detail.
Drilling Down to Dashboards
The Advanced Report Designer will now allow you to link (or drilldown) to a Dashboard instead of just another Advanced Report. The filtering action of drilling down is automatically applied to the tiles on the Dashboard, allowing a one-stop view of important data from another report.
Report Designer Upgrades
Changes to our Report Designer will mean enhancements for both users designing reports and for those viewing and interacting with reports. The new toolbar is easier to work with and easier to see. Prompting parameters now include dropdown lists with values from the data source that can be scrolled up or down. Prompting filters with a formula can also display a dropdown list of values—taking the guesswork out of filtering! Conditional formatting with formulas allows more powerful conditional formatting. A new color picker and “sticky” headings round out enhancements to the Report Designer for an all-around better experience for all users.
New Toolbar Icons and Layout
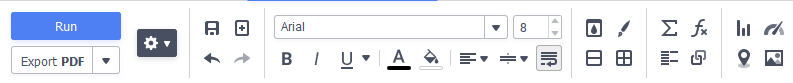
The Report Designer toolbar includes a new, bold icon set. Additionally, these new icons in the Advanced Report Designer are the same icons used in other parts of the application. This means that custom themes are easier to apply, and a uniform look-and-feel is quick to accomplish.
Read more about the Toolbar in our documentation.
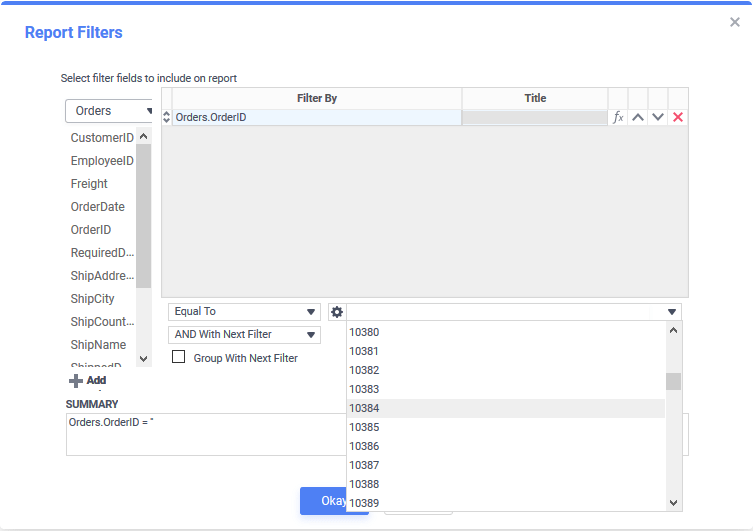
Parameter Dropdowns Load All Values
When a report contains a prompting parameter, a user will now be able to select any available value from the data source. Previously, only the first 100 values were available in the dropdown. Now, values load 100 at a time in the direction the user is scrolling. Scrolling works in both directions.
Formula Filters Show Available Filter Values In Dropdown
Whenever a filter uses a formula, a user will now be able to select any available calculated value from the data source in a dropdown. For example, a filter with the formula {OrderDetails.Quantity} * {OrderDetails.UnitPrice} will show the results of this calculation in the dropdown when the report is run. Previously, only a text field was available where a value would need to be keyed in.
New Color Picker
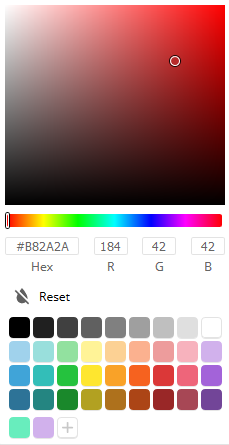
A new color picker is in use throughout the application. The new color picker makes more colors available to report designers, as well as directly entering hexadecimal or decimal color codes.
The bottom row of colors can show a default set of colors, can save preferred colors on a per-user basis or with extensibility, can be set by a system administrator.
“Sticky” Section Headers
When scrolling a report whose height or width is larger than the available screen space, section headers on the left side and top of the Advanced Report Designer will be frozen in place so you can still see them after scrolling.
Conditional Format with Functions
Those of you who work with our Advanced Report Designer may be familiar with Conditional Formatting. One application of Conditional Formatting is to change the color of text or a cell’s background. Previously, these colors changes were static choices made during the report design process. In v2019.2, the color attribute can be set dynamically with an Exago formula. This means that data fields, functions, calculations, parameters or cell values can be used to determine the color attribute. A new “Set by Formula” button appears in the color picker.
Scheduling with the REST Web Service API
A number of REST Web Service API endpoints have been added to the application that allow developers to create, modify, view and delete schedules programmatically. Several new enumerations and constants have been added as well to accommodate this new functionality.
Aggregate Functions
Custom Aggregate Functions
Just as Exago administrators can already create their own Custom Functions, administrators can now create their own Custom Aggregate Functions for aggregating data. Custom Aggregate Functions can be implemented in either C# or VB.NET directly through the Admin Console or programmatically through the .NET API. We have provided several examples of Custom Aggregate Functions in our documentation.
Aggregates in Group Headers
Aggregate Functions will now work as expected when placed directly into a group or section header. Previously, a cell reference was needed to make this work. Now, header aggregates are supported right out-of-the-box.
